*Python Draw a bargraph of English letter frequency Also save the bargraph in a file #...
*Python
Draw a bargraph of English letter frequency
Also save the bargraph in a file
# (1) import necessary modules/packages/libaries
# A dictionary containing the information of English letter
frequency
freq = {'a':8.17, 'b':1.49, 'c':2.2, 'd':4.25, 'e':12.7,
'f':2.23, 'g':2.02, 'h':6.09, 'i':7.0, 'j':0.15,
'k':1.29, 'l':4.02, 'm':2.41, 'n':6.74, 'o':7.5,
'p':1.92, 'q':0.09, 'r':5.99, 's':6.33, 't':9.36,
'u':2.75, 'v':0.98, 'w':2.56, 'x':0.15, 'y':1.99,
'z':0.08}
labels = []
data = []
# (2) extract data from dictionary freq to make two lists:
# labels contains all keys
# data contains all values
# set up for parameters for bargraph
width = 1
xlocations = np.array(range(len(data)))+width
# (3) call bar() function passing xlocation and data
# set up for y and x ticks and its position
plt.yticks(range(0, 15))
plt.xticks(xlocations, labels)
plt.xlim(0, xlocations[-1]+width)
# (4) set up for title of bargraph
# (5) save the figure in a file
# (6) display the figure
Homework Answers
Answer:
Raw code:
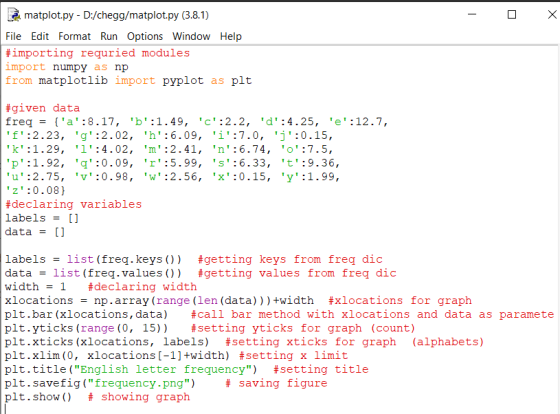
#importing requried modules
import numpy as np
from matplotlib import pyplot as plt
#given data
freq = {'a':8.17, 'b':1.49, 'c':2.2, 'd':4.25, 'e':12.7,
'f':2.23, 'g':2.02, 'h':6.09, 'i':7.0, 'j':0.15,
'k':1.29, 'l':4.02, 'm':2.41, 'n':6.74, 'o':7.5,
'p':1.92, 'q':0.09, 'r':5.99, 's':6.33, 't':9.36,
'u':2.75, 'v':0.98, 'w':2.56, 'x':0.15, 'y':1.99,
'z':0.08}
#declaring variables
labels = []
data = []
labels = list(freq.keys()) #getting keys from freq dic
data = list(freq.values()) #getting values from freq dic
width = 1 #declaring width
xlocations = np.array(range(len(data)))+width #xlocations for
graph
plt.bar(xlocations,data) #call bar method with xlocations and data
as parameters
plt.yticks(range(0, 15)) #setting yticks for graph (count)
plt.xticks(xlocations, labels) #setting xticks for graph
(alphabets)
plt.xlim(0, xlocations[-1]+width) #setting x limit
plt.title("English letter frequency") #setting title
plt.savefig("frequency.png") # saving figure
plt.show() # showing graph
note: please make sure that the indentation must be as like in the screen shots of my editor.
code:
out put:

saved file:

Feel free to ask doubts in the comment section.
Please do upvote.
Thank you.
Add Answer to:
*Python
Draw a bargraph of English letter frequency
Also save the bargraph in a file
#...
In python Count the frequency of each word in a text file. Let the user choose...
In python Count the frequency of each word in a text file. Let the user choose a filename to read. 1. The program will count the frequency with which each word appears in the text. 2. Words which are the spelled the same but differ by case will be combined. 3. Punctuation should be removed 4. If the file does not exist, use a ‘try-execption’ block to handle the error 5. Output will list the words alphabetically, with the word...
Could anyone help add to my python code? I now need to calculate the mean and...
Could anyone help add to my python code? I now need to calculate the mean and median. In this programming assignment you are to extend the program you wrote for Number Stats to determine the median and mode of the numbers read from the file. You are to create a program called numstat2.py that reads a series of integer numbers from a file and determines and displays the following: The name of the file. The sum of the numbers. The...
I have completed these but wanting to compare such as Question 14. Is the word "Total"...
I have completed these but wanting to compare such as Question 14. Is the word "Total" added in the row or written as "Average" or "Total Average" Also Question 8 is not clear what fill color. Is it supposed to stay as blue and just select gradient fill? Very unclear questions. Thank you. Question: EX16_XL_VOL1_GRADER_CAP_AS – Travel Vacations 1.4 ( Excel, Chapter 4) Project Description: 1 Start Excel. Download and open the file named exploring_ecap_grader_a1.xlsx. 2 On the DC worksheet,...
Most questions answered within 3 hours.
-
Why would natural selection not minimize costs (in the form of
symptoms) of evolved defenses? (choose...
asked 4 minutes ago -
What is true about a critical task?
Latest finish time - latest start time = 0...
asked 6 minutes ago -
A company uses a
process costing system. Its Assembly Department's beginning
inventory consisted of 56,800 units,...
asked 6 minutes ago -
a
sealed glass cylinder contains 325 g of N2 gas at 1.02 atm at 20 c....
asked 10 minutes ago -
The main difference between an equity and a nonequity alliance
is that
A
equity alliances are...
asked 9 minutes ago -
Need help with this, in JAVA, using netbeans. A
complete response will receive a positive comment...
asked 17 minutes ago -
An imprest petty cash fund of $600 was established for minor
disbursements. At the end of...
asked 22 minutes ago -
Sharpe Cutter is a small company that produces specialty knives
for paper cutting machinery. The annual...
asked 27 minutes ago -
Calculating the Ka of a weak acid from
pH:
The pH of a 0.68M solution of...
asked 28 minutes ago -
1.What process is pushing back against gravity in the very
center (the core) of sun-like stars?...
asked 48 minutes ago -
This question is from the textbook "Python for ArcGIS" by Laura
Tateosian:
Write a script "triangles.py"...
asked 46 minutes ago -
Which of the following is an impediment that makes it
difficult for firms to achieve the...
asked 47 minutes ago