Using Supply and Demand Diagrams explain how the supply and/or demand for beef and grain are...
Using Supply and Demand Diagrams explain how the supply and/or demand for beef and grain are related. Bumper grain crops this year will further encourage meat production.
Homework Answers
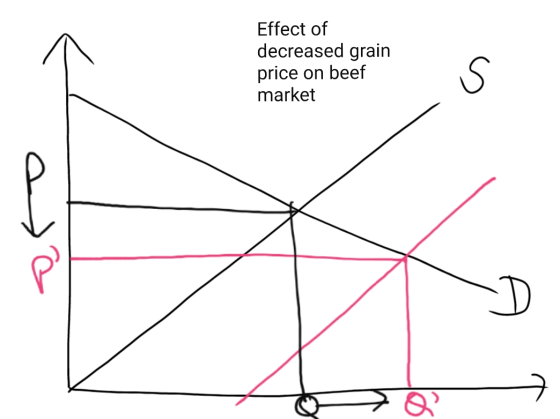
Ans) Firstly, when price of raw material changes, supply changes and there is a shift in supply curve.
Now, grain can be considered as input for beef market because if cattles are fed properly, there will be sufficient meat to supply. And if cattles are not fed properly, there will insufficient meat. Further, feeding cattles depends upon the price of grains.
Therefore, when there is bumper grain crop, price of grain will reduce. As a result, input cost for beef will also reduce and supply of beef will increase. (Opposite will happen if there is famine or drought or any other event which reduces production of grains.)

Add Answer to:
Using Supply and Demand Diagrams explain how the supply and/or
demand for beef and grain are...
Explain by using graph how exchange rate determined Use supply and demand diagrams to verify answers....
 Explain by using graph how exchange rate determined Use supply and demand diagrams to verify answers. A. Supply decreases and demand is constant B. Demand decreases and supply is constant. C. Supply increases and demand is constant D. Demand increases and supply increases E. Demand increases and supply is constant. F. Supply increases and demand decreases. G. Demand increases and supply decreases H. Demand decreases and supply decreases
using separate demand and supply diagrams explain the effect on the price and quantity of smartphones...
using separate demand and supply diagrams explain the effect on the price and quantity of smartphones if the electronic worker's wages rises
using separate demand and supply diagrams explain the effect on the price and quantity of smartphones...
using separate demand and supply diagrams explain the effect on the price and quantity of smartphones if the price of music streaming subscription falls?
Use supply and demand diagrams to illustrate the qualitative effect of the following shocks to the...
Use supply and demand diagrams to illustrate the qualitative effect of the following shocks to the Canadian beef market. In each case, explain what happens to the equilibrium price and quantity using words. (a) A new study shows there are significant health risks associated with consuming too much beef. (b) Personal income tax rates fall by 50%. (c) A new plant-based “meatless” burger is introduced onto the market. (d) An outbreak of BSE (“mad cow disease”) is found in a...
1. Explain each of the following statements using supply-and-demand diagrams. a. “When a cold snap hits...
1. Explain each of the following statements using supply-and-demand diagrams. a. “When a cold snap hits Florida, the price of orange juice rises in supermarkets throughout the country.” b. “When the weather turns warm in New England every summer, the price of hotel rooms in Caribbean resorts plummets.” c. “When a war breaks out in the Middle East, the price of gasoline rises and the price of a used Cadillac falls.” Hints: • Draw both supply and demand curve of...
Using separate demand and supply diagrams for A), B), and C) below, explain the effect on...
Using separate demand and supply diagrams for A), B), and C) below, explain the effect on the price and quantity of smartphones if: A) The price of a music streaming subscription falls (4 marks) B) Electronics workers’ wages rise (4 marks) C) The events described in A) and B) above occur together (4 marks)
This question will deal with demand, supply, equilibrium and comparative statics in a specific market: the...
This question will deal with demand, supply, equilibrium and comparative statics in a specific market: the market for pork. We will use specific equations for Demand and Supply of pork which come from an academic paper: “Production Subsidy and Countervailing Duties in Vertically Related Markets: The Hog-Pork Case Between Canada and the United States” written by Giancarlo Moschini and Karl D. Meilke which appeared in American Journal of Agricultural Economics, Vol. 74, No. 4 (Nov., 1992), pp.951-961. The authors estimated...
Using supply and demand diagrams briefly describe the likely consequence of a price ceiling on orange juice. Are price ceilings bad? Explain
Using supply and demand diagrams briefly describe the likely consequence of a price ceiling on orange juice. Are price ceilings bad? Explain
1. (15 points possible) Brazil and Argentina can both produce beef and sugar. The production possibilities...
 1. (15 points possible) Brazil and Argentina can both produce beef and sugar. The production possibilities frontiers are given by the table below. (You may assume respectively constant opportunity costs.) Brazil Max. number of per year Beef (000s of tons) Sugar (000s of tons) 15 20 Argentina 30 10 Determine a mutually beneficial trade agreement between Brazil and Argentina; describe it as fully as possible (and draw supporting diagrams). Explain how & why the agreement is beneficial to each party?...
Using diagrams, compare and contrast the objectives of demand-side and supply-side policies.
Using diagrams, compare and contrast the objectives of demand-side and supply-side policies.
 Explain by using graph how exchange rate determined Use supply and demand diagrams to verify answers. A. Supply decreases and demand is constant B. Demand decreases and supply is constant. C. Supply increases and demand is constant D. Demand increases and supply increases E. Demand increases and supply is constant. F. Supply increases and demand decreases. G. Demand increases and supply decreases H. Demand decreases and supply decreases
 1. (15 points possible) Brazil and Argentina can both produce beef and sugar. The production possibilities frontiers are given by the table below. (You may assume respectively constant opportunity costs.) Brazil Max. number of per year Beef (000s of tons) Sugar (000s of tons) 15 20 Argentina 30 10 Determine a mutually beneficial trade agreement between Brazil and Argentina; describe it as fully as possible (and draw supporting diagrams). Explain how & why the agreement is beneficial to each party?...
Most questions answered within 3 hours.
-
An entomologist discovers a dung beetle rolling a ball of dung
along the ground, and decides...
asked 3 minutes ago -
Humans have used horses for transportation for millions of
years. Therefore, they will use horses for...
asked 1 hour ago -
The following are the Jensen Corporation's unit costs of making
and selling an item at a...
asked 2 hours ago -
Does direct Medicare reimbursement of Advanced practice nurses
increase access to their services?
asked 3 hours ago -
List and explain why a company would choose to use a
published
compensation survey vs. creating...
asked 3 hours ago -
A discrete random variable X can take values from 1 to 10. Find
the variance of...
asked 3 hours ago -
The primary financial goal of a corporation is to maximize:
shareholders wealth.
earnings per share.
stock...
asked 3 hours ago -
determine whether the vectors u=(1,2,3,), v=(-2,1,0) and
w=(1,0,1) are linearly dependent or independent.
asked 3 hours ago -
python
Define a function called print_values which takes a dictionary
object as a parameter. The function...
asked 4 hours ago -
In Chapter 1 you created a program named Triangle in
which you displayed a seven-line triangle...
asked 4 hours ago -
Research question: What are the differences between separately
stated and non separately stated transactions in an...
asked 5 hours ago -
By using Arduino write a code that connects two LEDs to two
push-buttons. Each button controls...
asked 6 hours ago