Assume that the probability distribution of the net deposit drain of a Depository Institution (DI) has...
Assume that the probability distribution of the net deposit drain of a Depository Institution (DI) has been estimated to have a mean of 3 per cent of total deposits and a standard deviation of 1 per cent. Is this DI increasing or decreasing in size? Explain.
Below is part of the answer. What I want to know is hot do you get the values between 1 and 5 percent? Also the 95%
If the distribution is normal, we can state with 95 per cent confidence that the rate of decrease of deposits will be between 1 per cent and 5 per cent
Homework Answers
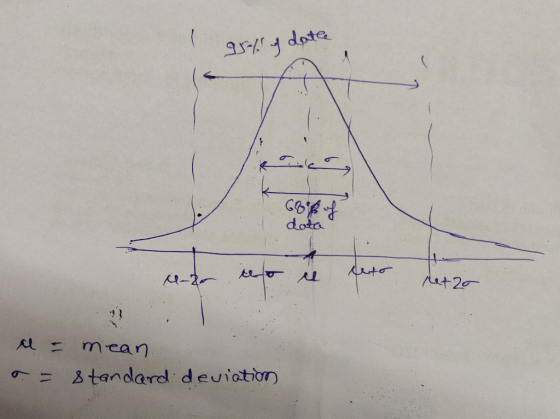
See the image below. In the normal distribution, 1 standard deviation around the mean covers approx 68 percent of the data and 2 standard deviation around the mean covers the approx 95 percent of the data. and since the mean is 3 and the standard deviation is 1:
3 - 1 < x < 3 + 1 will cover the 68 percent of the data.
3 - 2 < x < 3 + 2 will cover the 95 percent of the data.
3 - 3 < x < 3 + 3 will cover 99.7 percent of the data.
Since 95 percent confidence interval is the most commonly used in statistics, they have given answer in the term of 95 percent confidence interval. Otherwise, you can also write the answer as
If the distribution is normal, we can state with 68 percent confidence that the rate of decrease of deposits will be between 2 percent and 4 percent
or
If the distribution is normal, we can state with 99.7 percent confidence that the rate of decrease of deposits will be between 0 percent and 6 percent
All the answers will be correct
Remember this percentage as they are very commonly used in statistics.
Hope it helps !
Add Answer to:
Assume that the probability distribution of the net deposit
drain of a Depository Institution (DI) has...
1) A sample of size 25 is chosen from a population. Assume the probability distribution is...
1) A sample of size 25 is chosen from a population. Assume the probability distribution is normal. If the mean of the sample is 80 and the standard deviation is 6, find the lower bound of the 99% confidence interval. Round off to three decimal places. 2) A sample of size 36 is chosen from a population. The sample mean is 50 and the standard deviation is 5. Find the upper limit of the 95% confidence interval for the population...
2. 22 random samples were selected from a population that has a normal distribution. The sample...
 2. 22 random samples were selected from a population that has a normal distribution. The sample (1 point) has a mean of 99 and a standard deviation of 5 . Construct a 95% confidence interval for the population standard deviation 76 < σ < 141 3.What are the critical values 2? and 2 that correspond to a 99% confidence level and a (lpom) sample size of 30? 13.121, 52.336 13.787, 53.672 14.257, 49.588 19.768, 39.087
Assume the grades has Normal distribution with the mean of 70, and the standard deviation of 15. Answer the following questions 1. Calculate 10t 25t* 50 75t and 90* percentiles once by converting to...
 Assume the grades has Normal distribution with the mean of 70, and the standard deviation of 15. Answer the following questions 1. Calculate 10t 25t* 50 75t and 90* percentiles once by converting to the standard Normal distribution, and again directly (using the non-standard Normal distribution) 2. What percentage of students score between 80 and 90 in the exam? 3. What percentage of students fail? 4. What percentage of students pass with A? 5. Generate a sample of size 16...
In a 95% confidence interval. i 1-0.0s is called the confidence coefficient. A) True lB) False...
 In a 95% confidence interval. i 1-0.0s is called the confidence coefficient. A) True lB) False If a 95% confidence interval on the mean has a lower limit of 10 and an upper limit that 95% of the time the true value of the mean is between 10 and 15. ) True B) False For a fixed value of the standard deviation and a fixed sample size, a confidence inte population mean will get longer as the level of confidence...
R problem 1: The reason that the t distribution is important is that the sampling distribution...
 R problem 1: The reason that the t distribution is important is that the sampling distribution of the standardized sample mean is different depending on whether we use the true population standard deviation or one estimated from sample data. This problem addresses this issue. 1. Generate 10,000 samples of size n- 4 from a normal distribution with mean 100 and standard deviation σ = 12, Find the 10,000 sample means and find the 10,000 sample standard deviations. What are the...
1) Random variable x has a uniform distribution defined by the probability density function below. Determine...
1) Random variable x has a uniform distribution defined by the probability density function below. Determine the probability that x has a value of at least 220. f(x) = 1/100 for values of x between 200 and 300, and 0 everywhere else A) 0.65 B) 0.80 C) 0.75 D) 0.60 2) The method of sampling that ensures that every subgroup of interest in a particular study is represented in the sample is called: A) systematic random sampling B)...
multiple choice: 4) The sampling distribution of x̅1-x̅2 has a mean value equal to . a....
multiple choice: 4) The sampling distribution of x̅1-x̅2 has a mean value equal to . a. 0 b. μ1-μ2 c. N d. Sx̅1- x̅2 True-false questions 5) If we reject H0 one can say the experimental results are significant. 6) By making alpha smaller we can decrease the probability of making a Type I error. 7) As the probability of making a Type I error goes down by making α more stringent, the probability of making a Type II error...
Solocting a distribution for inforences on the population mean Suppose that we want to estimate the number of holdi...
 Solocting a distribution for inforences on the population mean Suppose that we want to estimate the number of holding penalties assessed during a college football game. The sample of games we pick has a mean of 3.4 penalties per game and a standard deviation of 0.7 penalties per game. For each of the following sampling scenarios, determine which test statistic is appropriate to use when making inference statements about the population mean. (In the table, Z refers to a variable...
 2. 22 random samples were selected from a population that has a normal distribution. The sample (1 point) has a mean of 99 and a standard deviation of 5 . Construct a 95% confidence interval for the population standard deviation 76 < σ < 141 3.What are the critical values 2? and 2 that correspond to a 99% confidence level and a (lpom) sample size of 30? 13.121, 52.336 13.787, 53.672 14.257, 49.588 19.768, 39.087
 Assume the grades has Normal distribution with the mean of 70, and the standard deviation of 15. Answer the following questions 1. Calculate 10t 25t* 50 75t and 90* percentiles once by converting to the standard Normal distribution, and again directly (using the non-standard Normal distribution) 2. What percentage of students score between 80 and 90 in the exam? 3. What percentage of students fail? 4. What percentage of students pass with A? 5. Generate a sample of size 16...
 In a 95% confidence interval. i 1-0.0s is called the confidence coefficient. A) True lB) False If a 95% confidence interval on the mean has a lower limit of 10 and an upper limit that 95% of the time the true value of the mean is between 10 and 15. ) True B) False For a fixed value of the standard deviation and a fixed sample size, a confidence inte population mean will get longer as the level of confidence...
 R problem 1: The reason that the t distribution is important is that the sampling distribution of the standardized sample mean is different depending on whether we use the true population standard deviation or one estimated from sample data. This problem addresses this issue. 1. Generate 10,000 samples of size n- 4 from a normal distribution with mean 100 and standard deviation σ = 12, Find the 10,000 sample means and find the 10,000 sample standard deviations. What are the...
 Solocting a distribution for inforences on the population mean Suppose that we want to estimate the number of holding penalties assessed during a college football game. The sample of games we pick has a mean of 3.4 penalties per game and a standard deviation of 0.7 penalties per game. For each of the following sampling scenarios, determine which test statistic is appropriate to use when making inference statements about the population mean. (In the table, Z refers to a variable...
Most questions answered within 3 hours.
-
39.4% of US homes continue to use a landline in addition to cell
phone service. 3...
asked 25 minutes ago -
Starting with benzene, synthesize 1-phenyl-1-butyne.
Show intermediates and reagents.
asked 1 hour ago -
Create a 32-run crossed array design with six control factors
and two noise factors such that...
asked 2 hours ago -
A 500g sample of sand from source A has the following amounts
retained on each sieve....
asked 2 hours ago -
In
your own words, please explain the essay by John Keynes wrote "The
End of Laissez...
asked 2 hours ago -
How are the matrix and pixels related? Why are smaller
pixels better for diagnostic quality?
asked 2 hours ago -
2. An AC generator has 80 rectangular loops on
its armature. Each loop is 11 cm...
asked 2 hours ago -
Please help me with this question. Consider Aldi’s current and
potential geographic markets (see Exhibit 4...
asked 2 hours ago -
What are the main components of the fermentation process and
give an explanation of each? Include...
asked 2 hours ago -
Explain which types of cells in the body (belonging to which
organs, etc.) are sensitive to...
asked 2 hours ago -
A single cable supports an 703-kg elevator car. What is the
tension in the cable when...
asked 2 hours ago -
among the three different ways to link CSS specifications to an
HTML document (inline CSS, document...
asked 3 hours ago