Ask 3 people, whose height and shoe length you have not used to prepare the graph,...
Ask 3 people, whose height and shoe length you have not used to prepare the graph, for their height and shoe length. Then see how accurately your line predicts what their shoe length should be. Do this by physically (print out graph) or virtually (use graph on computer) finding each person's height on the vertical axis (y-axis) of your trend line plot and then draw or follow a line straight across to the right until you intersect the trend line on the graph. Drop down a straight line to read the predicted shoe length from the horizontal axis (x-axis) directly below the point of intersection. Prepare a table, and only a table, comparing the 3 people’s height, predicted shoe length, and actual shoe length.
Homework Answers
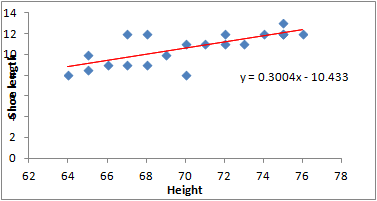
I am using a dummy data of 20 men's height and shoe length. Shoe length is our predictive variable and height is our independent variable.
excel data (measured in inches)
| Height (X) | Shoe length (y) |
| 68 | 12 |
| 66 | 9 |
| 75 | 12 |
| 71 | 11 |
| 67 | 12 |
| 65 | 8.5 |
| 67 | 9 |
| 75 | 13 |
| 72 | 11 |
| 74 | 12 |
| 72 | 12 |
| 75 | 12 |
| 69 | 10 |
| 70 | 11 |
| 65 | 10 |
| 64 | 8 |
| 68 | 9 |
| 73 | 11 |
| 70 | 8 |
| 76 | 12 |
Chart is prepared in excel

The regression equation is
Y = 0.3004x - 10.433
slope =0.03004 and y-interept = -10.433
New data
| Heigth | Shoe
length Actual |
Shoe
length predicted |
| 66 | 10 | 9.3934 |
| 64 | 13 | 8.7926 |
| 72 | 12 | 11.1958 |
The predicted shoe length is found by subsituting corresponding Heights in the the formula
Y = 0.3004x - 10.433

Apologies I couldn't plot both lines on one chart.
looking at both the charts we can see that both trendlines would overlap each other.
Add Answer to:
Ask 3 people, whose height and shoe length you have not used to
prepare the graph,...
Hi, I have answers some of the questions,, I just have trouble with number 3, 6...
 Hi, I have answers some of the questions,, I just have trouble
with number 3, 6 and 7 and this is about making a graph.. For this
graph we are just using a simple graphing paper and if you could
teach me how to graph these points and following the requirements
in the questions. thank you!
Water Volume and Mass 1. Position a meterstick vertically on a flat surface, such as a wall or the side of a lab bench....
Hi, I have answers some of the questions,, I just have trouble
with number 3, 6 and 7 and this is about making a graph.. For this
graph we are just using a simple graphing paper and if you could
teach me how to graph these points and following the requirements
in the questions. thank you!
Water Volume and Mass 1. Position a meterstick vertically on a flat surface, such as a wall or the side of a lab bench....
Most questions answered within 3 hours.
-
Water flows through a 8-foot wide and 4-foot tall rectangular
channel. If the desired flow rate...
asked 1 minute from now -
Do you believe that some things that fall into the category of
“pseudoscience” are worth believing...
asked 2 minutes ago -
Cruz Video Center accumulates the following cost and net
realizable data at December 31.
Cameras $14,700...
asked 2 minutes ago -
Direct Labor Variances
The following data relate to labor cost for production of 4,600
cellular telephones:...
asked 7 minutes ago -
1. Describe the differences between management in the nonprofit
sector and management in other sectors. How...
asked 8 minutes ago -
Identify the location of the following corresponding operand if
the address field in an instruction contains...
asked 10 minutes ago -
A new battery's voltage may be acceptable (A) or unacceptable
(U). A certain flashlight requires two...
asked 12 minutes ago -
Water has significant IMF, which result in many of its unique
properties—high boiling point relative to...
asked 31 minutes ago -
I need help with an executive summary for Adidas Items to be
included are a discription...
asked 24 minutes ago -
19. Most progressive reform activists were white
and a. upper class. b. lower class. c. wokring...
asked 27 minutes ago -
If X is a binomial random variable with n = 8
and p = 0.2, the...
asked 37 minutes ago -
Seasonal or cyclical variation in a time-series model…
---exhibits irregular
variation that can be accounted for...
asked 38 minutes ago