The comparative balance sheets for 2018 and 2017 and the statement of income for 2018 are...
The comparative balance sheets for 2018 and 2017 and the statement of income for 2018 are given below for National Intercable Company. Additional information from NIC’s accounting records is provided also.
| NATIONAL INTERCABLE COMPANY Comparative Balance Sheets December 31, 2018 and 2017 ($ in millions) |
||||||||
| 2018 | 2017 | |||||||
| Assets | ||||||||
| Cash | $ | 139 | $ | 130 | ||||
| Accounts receivable | 388 | 380 | ||||||
| Less: Allowance for uncollectible accounts | (10 | ) | (8 | ) | ||||
| Prepaid insurance | 5 | 12 | ||||||
| Inventory | 364 | 360 | ||||||
| Long-term investment | 66 | 110 | ||||||
| Land | 250 | 250 | ||||||
| Buildings and equipment | 374 | 350 | ||||||
| Less: Accumulated depreciation | (146 | ) | (120 | ) | ||||
| Trademark | 27 | 30 | ||||||
| $ | 1,457 | $ | 1,494 | |||||
| Liabilities | ||||||||
| Accounts payable | $ | 50 | $ | 68 | ||||
| Salaries payable | 3 | 6 | ||||||
| Deferred income tax liability | 21 | 15 | ||||||
| Lease liability | 88 | 0 | ||||||
| Bonds payable | 140 | 320 | ||||||
| Less: Discount on bonds | (29 | ) | (35 | ) | ||||
| Shareholders' Equity | ||||||||
| Common stock | 370 | 350 | ||||||
| Paid-in capital—excess of par | 145 | 125 | ||||||
| Preferred stock | 50 | 0 | ||||||
| Retained earnings | 619 | 645 | ||||||
| $ | 1,457 | $ | 1,494 |
| NATIONAL INTERCABLE COMPANY Income Statement For Year Ended December 31, 2018 ($ in millions) |
||||||
| Revenues | ||||||
| Sales revenue | $ | 530 | ||||
| Investment revenue | 16 | |||||
| Gain on sale of investments | 6 | $ | 552 | |||
| Expenses | ||||||
| Cost of goods sold | 240 | |||||
| Salaries expense | 74 | |||||
| Depreciation expense | 45 | |||||
| Trademark amortization expense | 3 | |||||
| Bad debt expense | 8 | |||||
| Insurance expense | 38 | |||||
| Bond interest expense | 50 | |||||
| Loss on building fire | 52 | 510 | ||||
| Income before tax | 42 | |||||
| Income tax expense | 34 | |||||
| Net income | $ | 8 | ||||
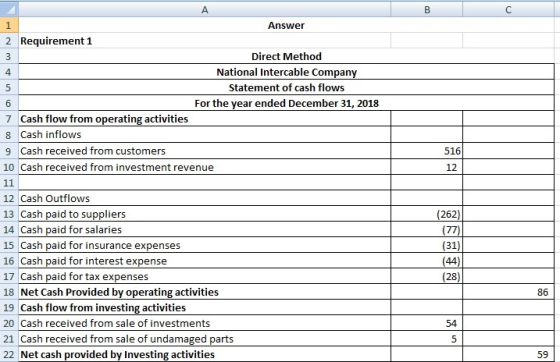
Additional information from the accounting records:
- Investment revenue includes National Intercable Company's $4 million share of the net income of Central Fiber Optics Corporation, an equity method investee.
- A long-term investment in bonds, originally purchased for $48 million, was sold for $54 million.
- Pretax accounting income exceeded taxable income causing the deferred income tax liability to increase by $6 million.
- A building that originally cost $76 million, and which was one-fourth depreciated, was destroyed by fire. Some undamaged parts were sold for $5 million.
- The right to use a building was acquired with a seven-year lease agreement; present value of lease payments, $100 million. Annual lease payments of $12 million are paid at Jan. 1 of each year starting in 2018.
- $180 million of bonds were retired at maturity.
- $20 million par value of common stock was sold for $40 million, and $50 million of preferred stock was sold at par.
- Shareholders were paid cash dividends of $34 million.
Required:
2. Prepare the statement of cash flows. Present
cash flows from operating activities by the direct method.
(Enter your answers in millions (i.e., 10,000,000 should be
entered as 10.). Amounts to be deducted should be indicated with a
minus sign.)
Homework Answers
The answer has been presented in the supporting sheets. All the parts has been solved with detailed explanation and formulas and format. For detailed answers refer to the supporting sheets.


Add Answer to:
The comparative balance sheets for 2018 and 2017 and the
statement of income for 2018 are...
2. The comparative balance sheets for 2018 and 2017 and the statement of income for 2018...
 2.
The comparative balance sheets for 2018 and 2017 and the
statement of income for 2018 are given below for National
Intercable Company. Additional information from NIC’s accounting
records is provided also.
NATIONAL INTERCABLE COMPANY
Comparative Balance Sheets
December 31, 2018 and 2017
($ in millions)
2018
2017
Assets
Cash
$
154
$
135
Accounts receivable
404
395
Less: Allowance for uncollectible accounts
(8
)
(6
)
Prepaid insurance
8
13
Inventory
384
375
Long-term investment
70
115
Land
260...
2.
The comparative balance sheets for 2018 and 2017 and the
statement of income for 2018 are given below for National
Intercable Company. Additional information from NIC’s accounting
records is provided also.
NATIONAL INTERCABLE COMPANY
Comparative Balance Sheets
December 31, 2018 and 2017
($ in millions)
2018
2017
Assets
Cash
$
154
$
135
Accounts receivable
404
395
Less: Allowance for uncollectible accounts
(8
)
(6
)
Prepaid insurance
8
13
Inventory
384
375
Long-term investment
70
115
Land
260...
Please help to fix my numbers The comparative balance sheets for 2018 and 2017 and the...
 Please help to fix my numbers
The comparative balance sheets for 2018 and 2017 and the statement of income for 2018 are given below for National Intercable Company. Add itional information from NIC's accounting records is provided also. 2 NATIONAL INTERCABLE COMPANY Comparative Balance Sheets December 31, 2018 and 2017 ($ in millions) 6.66 points 2018 2017 Assets Cash 106 95 Accounts receivable Less: Allowance for uncollectible 280 275 Print (6) (8) accounts References Prepaid insurance Inventory Long-term investment 10...
Please help to fix my numbers
The comparative balance sheets for 2018 and 2017 and the statement of income for 2018 are given below for National Intercable Company. Add itional information from NIC's accounting records is provided also. 2 NATIONAL INTERCABLE COMPANY Comparative Balance Sheets December 31, 2018 and 2017 ($ in millions) 6.66 points 2018 2017 Assets Cash 106 95 Accounts receivable Less: Allowance for uncollectible 280 275 Print (6) (8) accounts References Prepaid insurance Inventory Long-term investment 10...
The comparative balance sheets for 2021 and 2020 and the statement of income for 2021 are...
The comparative balance sheets for 2021 and 2020 and the statement of income for 2021 are given below for National Intercable Company. Additional information from NIC’s accounting records is provided also. NATIONAL INTERCABLE COMPANY Comparative Balance Sheets December 31, 2021 and 2020 ($ in millions) 2021 2020 Assets Cash $ 137 $ 115 Accounts receivable 342 335 Less: Allowance for uncollectible accounts (7 ) (5 ) Prepaid insurance 6 11 Inventory 320 315 Long-term investment 60 95 Land 220 220...
Is it correct? What is the acquired equipment? 110 or 97? The comparative balance sheets for...
 Is it correct? What is the acquired equipment? 110 or 97?
The comparative balance sheets for 2018 and 2017 and the statement of income for 2018 are given below for National Intercable Company. Additional information from NIC's accounting records is provided also. ΝΑΤΙΟΝAL INTERCABLE COMPANY Comparative Balance Sheets December 31, 2018 and 2017 ($ in millions) 2018 2017 Assets $ 154 404 $ 135 395 Cash Accounts receivable Less: Allowance for uncollectible (6) (8) асcounts Prepaid insurance Inventory Long-term investment...
Is it correct? What is the acquired equipment? 110 or 97?
The comparative balance sheets for 2018 and 2017 and the statement of income for 2018 are given below for National Intercable Company. Additional information from NIC's accounting records is provided also. ΝΑΤΙΟΝAL INTERCABLE COMPANY Comparative Balance Sheets December 31, 2018 and 2017 ($ in millions) 2018 2017 Assets $ 154 404 $ 135 395 Cash Accounts receivable Less: Allowance for uncollectible (6) (8) асcounts Prepaid insurance Inventory Long-term investment...
k my work mode : This shows what is correct or incorrect for the work you have completed so far. It does not indicate completio Return to qu The comparative balance sheets for 2018 and 2017 a...
 k my work mode : This shows what is correct or incorrect for the work you have completed so far. It does not indicate completio Return to qu The comparative balance sheets for 2018 and 2017 and the statement of income for 2018 are given below for N Company. Additional information from NIC's accounting records is provided also ational Intercable NATIONAL İNTERCABLE COMPANY Comparative Balance Sheets December 31, 2018 and 2017 (s in millions) 2018 2017 Assets Cash $ 157...
The comparative balance sheets for 2018 and 2017 and the income statement for 2018 are given...
 The comparative balance sheets for 2018 and 2017 and the income
statement for 2018 are given below for Arduous Company. Additional
information from Arduous’s accounting records is provided
also.
ARDUOUS COMPANY
Comparative Balance Sheets
December 31, 2018 and 2017
($ in millions)
2018
2017
Assets
Cash
$
124
$
85
Accounts receivable
194
202
Investment revenue receivable
10
8
Inventory
213
204
Prepaid insurance
8
14
Long-term investment
168
129
Land
204
154
Buildings and equipment
422
408
Less: Accumulated...
The comparative balance sheets for 2018 and 2017 and the income
statement for 2018 are given below for Arduous Company. Additional
information from Arduous’s accounting records is provided
also.
ARDUOUS COMPANY
Comparative Balance Sheets
December 31, 2018 and 2017
($ in millions)
2018
2017
Assets
Cash
$
124
$
85
Accounts receivable
194
202
Investment revenue receivable
10
8
Inventory
213
204
Prepaid insurance
8
14
Long-term investment
168
129
Land
204
154
Buildings and equipment
422
408
Less: Accumulated...
The comparative balance sheets for 2018 and 2017 and the income statement for 2018 are given...
The comparative balance sheets for 2018 and 2017 and the income statement for 2018 are given below for Arduous Company. Additional information from Arduous’s accounting records is provided also. ARDUOUS COMPANY Comparative Balance Sheets December 31, 2018 and 2017 ($ in millions) 2018 2017 Assets Cash $ 138 $ 93 Accounts receivable 202 216 Investment revenue receivable 17 16 Inventory 218 212 Prepaid insurance 15 24 Long-term investment 185 135 Land 216 160 Buildings and equipment 428 420 Less: Accumulated...
The comparative balance sheets for 2018 and 2017 and the income statement for 2018 are given...
 The comparative balance sheets for 2018 and 2017 and the income
statement for 2018 are given below for Arduous Company. Additional
information from Arduous’s accounting records is provided
also.
ARDUOUS COMPANY
Comparative Balance Sheets
December 31, 2018 and 2017
($ in millions)
2018
2017
Assets
Cash
$
120
$
87
Accounts receivable
196
206
Investment revenue receivable
14
10
Inventory
212
206
Prepaid insurance
12
19
Long-term investment
176
131
Land
208
156
Buildings and equipment
418
412
Less: Accumulated...
The comparative balance sheets for 2018 and 2017 and the income
statement for 2018 are given below for Arduous Company. Additional
information from Arduous’s accounting records is provided
also.
ARDUOUS COMPANY
Comparative Balance Sheets
December 31, 2018 and 2017
($ in millions)
2018
2017
Assets
Cash
$
120
$
87
Accounts receivable
196
206
Investment revenue receivable
14
10
Inventory
212
206
Prepaid insurance
12
19
Long-term investment
176
131
Land
208
156
Buildings and equipment
418
412
Less: Accumulated...
7. The comparative balance sheets for 2018 and 2017 and the income statement for 2018 are...
7. The comparative balance sheets for 2018 and 2017 and the income statement for 2018 are given below for Arduous Company. Additional information from Arduous’s accounting records is provided also. ARDUOUS COMPANY Comparative Balance Sheets December 31, 2018 and 2017 ($ in millions) 2018 2017 Assets Cash $ 149 $ 101 Accounts receivable 210 234 Investment revenue receivable 27 24 Inventory 228 220 Prepaid insurance 25 33 Long-term investment 217 145 Land 236 170 Buildings and equipment 432 440 Less:...
The comparative balance sheets for 2018 and 2017 and the income statement for 2018 are given...
 The comparative balance sheets for 2018 and 2017 and the income
statement for 2018 are given below for Arduous Company. Additional
information from Arduous’s accounting records is provided also.
ARDUOUS COMPANY
Comparative Balance Sheets
December 31, 2018 and 2017
($ in millions)
2018
2017
Assets
Cash
$
120
$
87
Accounts receivable
196
206
Investment revenue receivable
14
10
Inventory
212
206
Prepaid insurance
12
19
Long-term investment
176
131
Land
208
156
Buildings and equipment
418
412
Less: Accumulated...
The comparative balance sheets for 2018 and 2017 and the income
statement for 2018 are given below for Arduous Company. Additional
information from Arduous’s accounting records is provided also.
ARDUOUS COMPANY
Comparative Balance Sheets
December 31, 2018 and 2017
($ in millions)
2018
2017
Assets
Cash
$
120
$
87
Accounts receivable
196
206
Investment revenue receivable
14
10
Inventory
212
206
Prepaid insurance
12
19
Long-term investment
176
131
Land
208
156
Buildings and equipment
418
412
Less: Accumulated...
 2.
The comparative balance sheets for 2018 and 2017 and the
statement of income for 2018 are given below for National
Intercable Company. Additional information from NIC’s accounting
records is provided also.
NATIONAL INTERCABLE COMPANY
Comparative Balance Sheets
December 31, 2018 and 2017
($ in millions)
2018
2017
Assets
Cash
$
154
$
135
Accounts receivable
404
395
Less: Allowance for uncollectible accounts
(8
)
(6
)
Prepaid insurance
8
13
Inventory
384
375
Long-term investment
70
115
Land
260...
2.
The comparative balance sheets for 2018 and 2017 and the
statement of income for 2018 are given below for National
Intercable Company. Additional information from NIC’s accounting
records is provided also.
NATIONAL INTERCABLE COMPANY
Comparative Balance Sheets
December 31, 2018 and 2017
($ in millions)
2018
2017
Assets
Cash
$
154
$
135
Accounts receivable
404
395
Less: Allowance for uncollectible accounts
(8
)
(6
)
Prepaid insurance
8
13
Inventory
384
375
Long-term investment
70
115
Land
260...
 Please help to fix my numbers
The comparative balance sheets for 2018 and 2017 and the statement of income for 2018 are given below for National Intercable Company. Add itional information from NIC's accounting records is provided also. 2 NATIONAL INTERCABLE COMPANY Comparative Balance Sheets December 31, 2018 and 2017 ($ in millions) 6.66 points 2018 2017 Assets Cash 106 95 Accounts receivable Less: Allowance for uncollectible 280 275 Print (6) (8) accounts References Prepaid insurance Inventory Long-term investment 10...
Please help to fix my numbers
The comparative balance sheets for 2018 and 2017 and the statement of income for 2018 are given below for National Intercable Company. Add itional information from NIC's accounting records is provided also. 2 NATIONAL INTERCABLE COMPANY Comparative Balance Sheets December 31, 2018 and 2017 ($ in millions) 6.66 points 2018 2017 Assets Cash 106 95 Accounts receivable Less: Allowance for uncollectible 280 275 Print (6) (8) accounts References Prepaid insurance Inventory Long-term investment 10...
 Is it correct? What is the acquired equipment? 110 or 97?
The comparative balance sheets for 2018 and 2017 and the statement of income for 2018 are given below for National Intercable Company. Additional information from NIC's accounting records is provided also. ΝΑΤΙΟΝAL INTERCABLE COMPANY Comparative Balance Sheets December 31, 2018 and 2017 ($ in millions) 2018 2017 Assets $ 154 404 $ 135 395 Cash Accounts receivable Less: Allowance for uncollectible (6) (8) асcounts Prepaid insurance Inventory Long-term investment...
Is it correct? What is the acquired equipment? 110 or 97?
The comparative balance sheets for 2018 and 2017 and the statement of income for 2018 are given below for National Intercable Company. Additional information from NIC's accounting records is provided also. ΝΑΤΙΟΝAL INTERCABLE COMPANY Comparative Balance Sheets December 31, 2018 and 2017 ($ in millions) 2018 2017 Assets $ 154 404 $ 135 395 Cash Accounts receivable Less: Allowance for uncollectible (6) (8) асcounts Prepaid insurance Inventory Long-term investment...
 k my work mode : This shows what is correct or incorrect for the work you have completed so far. It does not indicate completio Return to qu The comparative balance sheets for 2018 and 2017 and the statement of income for 2018 are given below for N Company. Additional information from NIC's accounting records is provided also ational Intercable NATIONAL İNTERCABLE COMPANY Comparative Balance Sheets December 31, 2018 and 2017 (s in millions) 2018 2017 Assets Cash $ 157...
 The comparative balance sheets for 2018 and 2017 and the income
statement for 2018 are given below for Arduous Company. Additional
information from Arduous’s accounting records is provided
also.
ARDUOUS COMPANY
Comparative Balance Sheets
December 31, 2018 and 2017
($ in millions)
2018
2017
Assets
Cash
$
124
$
85
Accounts receivable
194
202
Investment revenue receivable
10
8
Inventory
213
204
Prepaid insurance
8
14
Long-term investment
168
129
Land
204
154
Buildings and equipment
422
408
Less: Accumulated...
The comparative balance sheets for 2018 and 2017 and the income
statement for 2018 are given below for Arduous Company. Additional
information from Arduous’s accounting records is provided
also.
ARDUOUS COMPANY
Comparative Balance Sheets
December 31, 2018 and 2017
($ in millions)
2018
2017
Assets
Cash
$
124
$
85
Accounts receivable
194
202
Investment revenue receivable
10
8
Inventory
213
204
Prepaid insurance
8
14
Long-term investment
168
129
Land
204
154
Buildings and equipment
422
408
Less: Accumulated...
 The comparative balance sheets for 2018 and 2017 and the income
statement for 2018 are given below for Arduous Company. Additional
information from Arduous’s accounting records is provided
also.
ARDUOUS COMPANY
Comparative Balance Sheets
December 31, 2018 and 2017
($ in millions)
2018
2017
Assets
Cash
$
120
$
87
Accounts receivable
196
206
Investment revenue receivable
14
10
Inventory
212
206
Prepaid insurance
12
19
Long-term investment
176
131
Land
208
156
Buildings and equipment
418
412
Less: Accumulated...
The comparative balance sheets for 2018 and 2017 and the income
statement for 2018 are given below for Arduous Company. Additional
information from Arduous’s accounting records is provided
also.
ARDUOUS COMPANY
Comparative Balance Sheets
December 31, 2018 and 2017
($ in millions)
2018
2017
Assets
Cash
$
120
$
87
Accounts receivable
196
206
Investment revenue receivable
14
10
Inventory
212
206
Prepaid insurance
12
19
Long-term investment
176
131
Land
208
156
Buildings and equipment
418
412
Less: Accumulated...
 The comparative balance sheets for 2018 and 2017 and the income
statement for 2018 are given below for Arduous Company. Additional
information from Arduous’s accounting records is provided also.
ARDUOUS COMPANY
Comparative Balance Sheets
December 31, 2018 and 2017
($ in millions)
2018
2017
Assets
Cash
$
120
$
87
Accounts receivable
196
206
Investment revenue receivable
14
10
Inventory
212
206
Prepaid insurance
12
19
Long-term investment
176
131
Land
208
156
Buildings and equipment
418
412
Less: Accumulated...
The comparative balance sheets for 2018 and 2017 and the income
statement for 2018 are given below for Arduous Company. Additional
information from Arduous’s accounting records is provided also.
ARDUOUS COMPANY
Comparative Balance Sheets
December 31, 2018 and 2017
($ in millions)
2018
2017
Assets
Cash
$
120
$
87
Accounts receivable
196
206
Investment revenue receivable
14
10
Inventory
212
206
Prepaid insurance
12
19
Long-term investment
176
131
Land
208
156
Buildings and equipment
418
412
Less: Accumulated...
Most questions answered within 3 hours.
-
Let M = 8.00kg, m = 6.00kg, θ = 40.00, and the coefficient of
kinetic friction...
asked 25 seconds from now -
Java. For C through H True or false?
c. Primitive variables must be objects.
d. Integer...
asked 4 minutes ago -
Write a program that turns a 32-bit numeric value (e.g.,
0xFFFFh) and converts it to a...
asked 6 minutes ago -
A motor produces a torque of 0.25 N m at an angular velocity of
7200 revolutions...
asked 19 minutes ago -
***Please answer the below java question***
Are static methods inheritable? Can they be overridden?
asked 22 minutes ago -
In reaching her destination, a backpacker walks with an average
velocity of 1.13 m/s, due west....
asked 22 minutes ago -
Write two C programs that run a
server program and a client program concurrently.
Server program:...
asked 21 minutes ago -
Executive Program Practical Connection Assignment
Subject : Operations Security.
Assignment:
Provide a reflection of at least...
asked 31 minutes ago -
Every time Casey is at bat he has a 0.4 probability of
getting on base (assume...
asked 39 minutes ago -
The Walston Company is to be liquidated and has the following
liabilities:
Income taxes
$
9,400...
asked 46 minutes ago -
If
the more comprehensive data is available in MEPS, why does the NHIS
still exist? How...
asked 1 hour ago -
Koo argues that the Japanese economy in the 1990s suffered from
a balance sheet recession. What...
asked 1 hour ago