7. The comparative balance sheets for 2018 and 2017 and the income statement for 2018 are...
7.
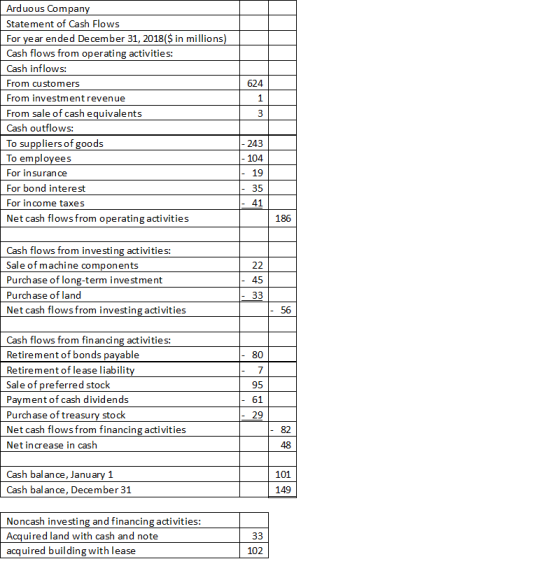
The comparative balance sheets for 2018 and 2017 and the income
statement for 2018 are given below for Arduous Company. Additional
information from Arduous’s accounting records is provided
also.
| ARDUOUS COMPANY Comparative Balance Sheets December 31, 2018 and 2017 ($ in millions) |
||||||||
| 2018 | 2017 | |||||||
| Assets | ||||||||
| Cash | $ | 149 | $ | 101 | ||||
| Accounts receivable | 210 | 234 | ||||||
| Investment revenue receivable | 27 | 24 | ||||||
| Inventory | 228 | 220 | ||||||
| Prepaid insurance | 25 | 33 | ||||||
| Long-term investment | 217 | 145 | ||||||
| Land | 236 | 170 | ||||||
| Buildings and equipment | 432 | 440 | ||||||
| Less: Accumulated depreciation | (118 | ) | (160 | ) | ||||
| Patent | 52 | 55 | ||||||
| $ | 1,458 | $ | 1,262 | |||||
| Liabilities | ||||||||
| Accounts payable | $ | 70 | $ | 105 | ||||
| Salaries payable | 27 | 38 | ||||||
| Bond interest payable | 29 | 24 | ||||||
| Income tax payable | 32 | 40 | ||||||
| Deferred income tax liability | 51 | 28 | ||||||
| Notes payable | 33 | 0 | ||||||
| Lease liability | 95 | 0 | ||||||
| Bonds payable | 235 | 315 | ||||||
| Less: Discount on bonds | (42 | ) | (50 | ) | ||||
| Shareholders’ Equity | ||||||||
| Common stock | 490 | 430 | ||||||
| Paid-in capital—excess of par | 135 | 105 | ||||||
| Preferred stock | 95 | 0 | ||||||
| Retained earnings | 237 | 227 | ||||||
| Less: Treasury stock | (29 | ) | 0 | |||||
| $ | 1,458 | $ | 1,262 | |||||
| ARDUOUS COMPANY Income Statement For Year Ended December 31, 2018 ($ in millions) |
||||||
| Revenues and gain: | ||||||
| Sales revenue | $ | 600 | ||||
| Investment revenue | 31 | |||||
| Gain on sale of treasury bills | 3 | $ | 634 | |||
| Expenses and loss: | ||||||
| Cost of goods sold | 200 | |||||
| Salaries expense | 93 | |||||
| Depreciation expense | 13 | |||||
| Patent amortization expense | 3 | |||||
| Insurance expense | 27 | |||||
| Bond interest expense | 48 | |||||
| Loss on machine damage | 33 | |||||
| Income tax expense | 56 | 473 | ||||
| Net income | $ | 161 | ||||
Additional information from the accounting records:
- Investment revenue includes Arduous Company’s $27 million share of the net income of Demur Company, an equity method investee.
- Treasury bills were sold during 2018 at a gain of $3 million. Arduous Company classifies its investments in Treasury bills as cash equivalents.
- A machine originally costing $110 million that was one-half depreciated was rendered unusable by a flood. Most major components of the machine were unharmed and were sold for $22 million.
- Temporary differences between pretax accounting income and taxable income caused the deferred income tax liability to increase by $23 million.
- The preferred stock of Tory Corporation was purchased for $45 million as a long-term investment.
- Land costing $66 million was acquired by issuing $33 million cash and a 15%, four-year, $33 million note payable to the seller.
- The right to use a building was acquired with a 15-year lease agreement; present value of lease payments, $102 million. Annual lease payments of $7 million are paid at the beginning of each year starting January 1, 2018.
- $80 million of bonds were retired at maturity.
- In February, Arduous issued a stock dividend (12.0 million shares). The market price of the $5 par value common stock was $7.50 per share at that time. Also the company paid a cash dividend.
- In April, 1 million shares of common stock were repurchased as treasury stock at a cost of $29.00 million.
Required:
Prepare the statement of cash flows of Arduous Company for the year
ended December 31, 2018. Present cash flows from operating
activities by the direct method. (Do not round your
intermediate calculations. Enter your answers in millions (i.e.,
10,000,000 should be entered as 10.). Amounts to be deducted should
be indicated with a minus sign.)
Homework Answers

Add Answer to:
7.
The comparative balance sheets for 2018 and 2017 and the income
statement for 2018 are...
The comparative balance sheets for 2018 and 2017 and the income statement for 2018 are given...
The comparative balance sheets for 2018 and 2017 and the income statement for 2018 are given below for Arduous Company. Additional information from Arduous’s accounting records is provided also. ARDUOUS COMPANY Comparative Balance Sheets December 31, 2018 and 2017 ($ in millions) 2018 2017 Assets Cash $ 138 $ 93 Accounts receivable 202 216 Investment revenue receivable 17 16 Inventory 218 212 Prepaid insurance 15 24 Long-term investment 185 135 Land 216 160 Buildings and equipment 428 420 Less: Accumulated...
The comparative balance sheets for 2018 and 2017 and the income statement for 2018 are given...
 The comparative balance sheets for 2018 and 2017 and the income
statement for 2018 are given below for Arduous Company. Additional
information from Arduous’s accounting records is provided
also.
ARDUOUS COMPANY
Comparative Balance Sheets
December 31, 2018 and 2017
($ in millions)
2018
2017
Assets
Cash
$
120
$
87
Accounts receivable
196
206
Investment revenue receivable
14
10
Inventory
212
206
Prepaid insurance
12
19
Long-term investment
176
131
Land
208
156
Buildings and equipment
418
412
Less: Accumulated...
The comparative balance sheets for 2018 and 2017 and the income
statement for 2018 are given below for Arduous Company. Additional
information from Arduous’s accounting records is provided
also.
ARDUOUS COMPANY
Comparative Balance Sheets
December 31, 2018 and 2017
($ in millions)
2018
2017
Assets
Cash
$
120
$
87
Accounts receivable
196
206
Investment revenue receivable
14
10
Inventory
212
206
Prepaid insurance
12
19
Long-term investment
176
131
Land
208
156
Buildings and equipment
418
412
Less: Accumulated...
The comparative balance sheets for 2018 and 2017 and the income statement for 2018 are given...
 The comparative balance sheets for 2018 and 2017 and the income
statement for 2018 are given below for Arduous Company. Additional
information from Arduous’s accounting records is provided
also.
ARDUOUS COMPANY
Comparative Balance Sheets
December 31, 2018 and 2017
($ in millions)
2018
2017
Assets
Cash
$
124
$
85
Accounts receivable
194
202
Investment revenue receivable
10
8
Inventory
213
204
Prepaid insurance
8
14
Long-term investment
168
129
Land
204
154
Buildings and equipment
422
408
Less: Accumulated...
The comparative balance sheets for 2018 and 2017 and the income
statement for 2018 are given below for Arduous Company. Additional
information from Arduous’s accounting records is provided
also.
ARDUOUS COMPANY
Comparative Balance Sheets
December 31, 2018 and 2017
($ in millions)
2018
2017
Assets
Cash
$
124
$
85
Accounts receivable
194
202
Investment revenue receivable
10
8
Inventory
213
204
Prepaid insurance
8
14
Long-term investment
168
129
Land
204
154
Buildings and equipment
422
408
Less: Accumulated...
The comparative balance sheets for 2018 and 2017 and the income statement for 2018 are given...
 The comparative balance sheets for 2018 and 2017 and the income
statement for 2018 are given below for Arduous Company. Additional
information from Arduous’s accounting records is provided also.
ARDUOUS COMPANY
Comparative Balance Sheets
December 31, 2018 and 2017
($ in millions)
2018
2017
Assets
Cash
$
120
$
87
Accounts receivable
196
206
Investment revenue receivable
14
10
Inventory
212
206
Prepaid insurance
12
19
Long-term investment
176
131
Land
208
156
Buildings and equipment
418
412
Less: Accumulated...
The comparative balance sheets for 2018 and 2017 and the income
statement for 2018 are given below for Arduous Company. Additional
information from Arduous’s accounting records is provided also.
ARDUOUS COMPANY
Comparative Balance Sheets
December 31, 2018 and 2017
($ in millions)
2018
2017
Assets
Cash
$
120
$
87
Accounts receivable
196
206
Investment revenue receivable
14
10
Inventory
212
206
Prepaid insurance
12
19
Long-term investment
176
131
Land
208
156
Buildings and equipment
418
412
Less: Accumulated...
The comparative balance sheets for 2016 and 2015 and the income statement for 2016 are given belo...
 The comparative balance sheets for 2016 and 2015 and the income statement for 2016 are given below for Arduous Company. Additional information from Arduous's accounting records is provided also. ARDUOUS COMPANY Comparative Balance Sheets Decernber 31, 2016 and 2015 $ in millions) 2016 2015 Assets S 118 $ 82 196 191 Accounts receivable Investment revenue receivable 207 Prepaid insurance Long-term investment 160 199 413 (98) (122) 126 151 402 Buildings and equipment $1,236 $1,085 Liabilities Accounts payable Salaries payable Bond...
The comparative balance sheets for 2021 and 2020 and the income statement for 2021 are given...
 The comparative balance sheets for 2021 and 2020 and the income statement for 2021 are given below for Arduous Company. Additional Information from Arduous's accounting records is provided also. ARDUOUS COMPANY Comparative Balance Sheets December 31, 2021 and 2e2e ($ in millions) 2021 2020 $ Assets Cash Accounts receivable Investment revenue receivable Inventory Prepaid insurance Long-term investment Land Buildings and equipment Less: Accumulated depreciation Patent 138 2e5 23 222 21 203 226 427 (109) 43 $ 96 224 19 215...
The comparative balance sheets for 2021 and 2020 and the income statement for 2021 are given...
 The comparative balance sheets for 2021 and 2020 and the income statement for 2021 are given below for Arduous Company. Additional Information from Arduous's accounting records is provided also. ARDUOUS COMPANY Comparative Balance Sheets December 31, 2021 and 2020 ($ in millions) 2021 2020 Assets Cash Accounts receivable Investment revenue receivable Inventory Prepaid insurance Long-term investment Land Buildings and equipment Less: Accumulated depreciation Patent $ 126 201 17 219 15 189 219 430 (107) 42 $1,351 $ 92 216 15...
The comparative balance sheets for 2018 and 2017 and the statement of income for 2018 are...
The comparative balance sheets for 2018 and 2017 and the statement of income for 2018 are given below for National Intercable Company. Additional information from NIC’s accounting records is provided also. NATIONAL INTERCABLE COMPANY Comparative Balance Sheets December 31, 2018 and 2017 ($ in millions) 2018 2017 Assets Cash $ 139 $ 130 Accounts receivable 388 380 Less: Allowance for uncollectible accounts (10 ) (8 ) Prepaid insurance 5 12 Inventory 364 360 Long-term investment 66 110 Land 250 250...
2. The comparative balance sheets for 2018 and 2017 and the statement of income for 2018...
 2.
The comparative balance sheets for 2018 and 2017 and the
statement of income for 2018 are given below for National
Intercable Company. Additional information from NIC’s accounting
records is provided also.
NATIONAL INTERCABLE COMPANY
Comparative Balance Sheets
December 31, 2018 and 2017
($ in millions)
2018
2017
Assets
Cash
$
154
$
135
Accounts receivable
404
395
Less: Allowance for uncollectible accounts
(8
)
(6
)
Prepaid insurance
8
13
Inventory
384
375
Long-term investment
70
115
Land
260...
2.
The comparative balance sheets for 2018 and 2017 and the
statement of income for 2018 are given below for National
Intercable Company. Additional information from NIC’s accounting
records is provided also.
NATIONAL INTERCABLE COMPANY
Comparative Balance Sheets
December 31, 2018 and 2017
($ in millions)
2018
2017
Assets
Cash
$
154
$
135
Accounts receivable
404
395
Less: Allowance for uncollectible accounts
(8
)
(6
)
Prepaid insurance
8
13
Inventory
384
375
Long-term investment
70
115
Land
260...
Please help to fix my numbers The comparative balance sheets for 2018 and 2017 and the...
 Please help to fix my numbers
The comparative balance sheets for 2018 and 2017 and the statement of income for 2018 are given below for National Intercable Company. Add itional information from NIC's accounting records is provided also. 2 NATIONAL INTERCABLE COMPANY Comparative Balance Sheets December 31, 2018 and 2017 ($ in millions) 6.66 points 2018 2017 Assets Cash 106 95 Accounts receivable Less: Allowance for uncollectible 280 275 Print (6) (8) accounts References Prepaid insurance Inventory Long-term investment 10...
Please help to fix my numbers
The comparative balance sheets for 2018 and 2017 and the statement of income for 2018 are given below for National Intercable Company. Add itional information from NIC's accounting records is provided also. 2 NATIONAL INTERCABLE COMPANY Comparative Balance Sheets December 31, 2018 and 2017 ($ in millions) 6.66 points 2018 2017 Assets Cash 106 95 Accounts receivable Less: Allowance for uncollectible 280 275 Print (6) (8) accounts References Prepaid insurance Inventory Long-term investment 10...
 The comparative balance sheets for 2018 and 2017 and the income
statement for 2018 are given below for Arduous Company. Additional
information from Arduous’s accounting records is provided
also.
ARDUOUS COMPANY
Comparative Balance Sheets
December 31, 2018 and 2017
($ in millions)
2018
2017
Assets
Cash
$
120
$
87
Accounts receivable
196
206
Investment revenue receivable
14
10
Inventory
212
206
Prepaid insurance
12
19
Long-term investment
176
131
Land
208
156
Buildings and equipment
418
412
Less: Accumulated...
The comparative balance sheets for 2018 and 2017 and the income
statement for 2018 are given below for Arduous Company. Additional
information from Arduous’s accounting records is provided
also.
ARDUOUS COMPANY
Comparative Balance Sheets
December 31, 2018 and 2017
($ in millions)
2018
2017
Assets
Cash
$
120
$
87
Accounts receivable
196
206
Investment revenue receivable
14
10
Inventory
212
206
Prepaid insurance
12
19
Long-term investment
176
131
Land
208
156
Buildings and equipment
418
412
Less: Accumulated...
 The comparative balance sheets for 2018 and 2017 and the income
statement for 2018 are given below for Arduous Company. Additional
information from Arduous’s accounting records is provided
also.
ARDUOUS COMPANY
Comparative Balance Sheets
December 31, 2018 and 2017
($ in millions)
2018
2017
Assets
Cash
$
124
$
85
Accounts receivable
194
202
Investment revenue receivable
10
8
Inventory
213
204
Prepaid insurance
8
14
Long-term investment
168
129
Land
204
154
Buildings and equipment
422
408
Less: Accumulated...
The comparative balance sheets for 2018 and 2017 and the income
statement for 2018 are given below for Arduous Company. Additional
information from Arduous’s accounting records is provided
also.
ARDUOUS COMPANY
Comparative Balance Sheets
December 31, 2018 and 2017
($ in millions)
2018
2017
Assets
Cash
$
124
$
85
Accounts receivable
194
202
Investment revenue receivable
10
8
Inventory
213
204
Prepaid insurance
8
14
Long-term investment
168
129
Land
204
154
Buildings and equipment
422
408
Less: Accumulated...
 The comparative balance sheets for 2018 and 2017 and the income
statement for 2018 are given below for Arduous Company. Additional
information from Arduous’s accounting records is provided also.
ARDUOUS COMPANY
Comparative Balance Sheets
December 31, 2018 and 2017
($ in millions)
2018
2017
Assets
Cash
$
120
$
87
Accounts receivable
196
206
Investment revenue receivable
14
10
Inventory
212
206
Prepaid insurance
12
19
Long-term investment
176
131
Land
208
156
Buildings and equipment
418
412
Less: Accumulated...
The comparative balance sheets for 2018 and 2017 and the income
statement for 2018 are given below for Arduous Company. Additional
information from Arduous’s accounting records is provided also.
ARDUOUS COMPANY
Comparative Balance Sheets
December 31, 2018 and 2017
($ in millions)
2018
2017
Assets
Cash
$
120
$
87
Accounts receivable
196
206
Investment revenue receivable
14
10
Inventory
212
206
Prepaid insurance
12
19
Long-term investment
176
131
Land
208
156
Buildings and equipment
418
412
Less: Accumulated...
 The comparative balance sheets for 2016 and 2015 and the income statement for 2016 are given below for Arduous Company. Additional information from Arduous's accounting records is provided also. ARDUOUS COMPANY Comparative Balance Sheets Decernber 31, 2016 and 2015 $ in millions) 2016 2015 Assets S 118 $ 82 196 191 Accounts receivable Investment revenue receivable 207 Prepaid insurance Long-term investment 160 199 413 (98) (122) 126 151 402 Buildings and equipment $1,236 $1,085 Liabilities Accounts payable Salaries payable Bond...
 The comparative balance sheets for 2021 and 2020 and the income statement for 2021 are given below for Arduous Company. Additional Information from Arduous's accounting records is provided also. ARDUOUS COMPANY Comparative Balance Sheets December 31, 2021 and 2e2e ($ in millions) 2021 2020 $ Assets Cash Accounts receivable Investment revenue receivable Inventory Prepaid insurance Long-term investment Land Buildings and equipment Less: Accumulated depreciation Patent 138 2e5 23 222 21 203 226 427 (109) 43 $ 96 224 19 215...
 The comparative balance sheets for 2021 and 2020 and the income statement for 2021 are given below for Arduous Company. Additional Information from Arduous's accounting records is provided also. ARDUOUS COMPANY Comparative Balance Sheets December 31, 2021 and 2020 ($ in millions) 2021 2020 Assets Cash Accounts receivable Investment revenue receivable Inventory Prepaid insurance Long-term investment Land Buildings and equipment Less: Accumulated depreciation Patent $ 126 201 17 219 15 189 219 430 (107) 42 $1,351 $ 92 216 15...
 2.
The comparative balance sheets for 2018 and 2017 and the
statement of income for 2018 are given below for National
Intercable Company. Additional information from NIC’s accounting
records is provided also.
NATIONAL INTERCABLE COMPANY
Comparative Balance Sheets
December 31, 2018 and 2017
($ in millions)
2018
2017
Assets
Cash
$
154
$
135
Accounts receivable
404
395
Less: Allowance for uncollectible accounts
(8
)
(6
)
Prepaid insurance
8
13
Inventory
384
375
Long-term investment
70
115
Land
260...
2.
The comparative balance sheets for 2018 and 2017 and the
statement of income for 2018 are given below for National
Intercable Company. Additional information from NIC’s accounting
records is provided also.
NATIONAL INTERCABLE COMPANY
Comparative Balance Sheets
December 31, 2018 and 2017
($ in millions)
2018
2017
Assets
Cash
$
154
$
135
Accounts receivable
404
395
Less: Allowance for uncollectible accounts
(8
)
(6
)
Prepaid insurance
8
13
Inventory
384
375
Long-term investment
70
115
Land
260...
 Please help to fix my numbers
The comparative balance sheets for 2018 and 2017 and the statement of income for 2018 are given below for National Intercable Company. Add itional information from NIC's accounting records is provided also. 2 NATIONAL INTERCABLE COMPANY Comparative Balance Sheets December 31, 2018 and 2017 ($ in millions) 6.66 points 2018 2017 Assets Cash 106 95 Accounts receivable Less: Allowance for uncollectible 280 275 Print (6) (8) accounts References Prepaid insurance Inventory Long-term investment 10...
Please help to fix my numbers
The comparative balance sheets for 2018 and 2017 and the statement of income for 2018 are given below for National Intercable Company. Add itional information from NIC's accounting records is provided also. 2 NATIONAL INTERCABLE COMPANY Comparative Balance Sheets December 31, 2018 and 2017 ($ in millions) 6.66 points 2018 2017 Assets Cash 106 95 Accounts receivable Less: Allowance for uncollectible 280 275 Print (6) (8) accounts References Prepaid insurance Inventory Long-term investment 10...
Most questions answered within 3 hours.
-
Although Epicurus advocates pursuing pleasure for the
good life, discuss a few reasons why he does...
asked 7 minutes ago -
Problem 1: Present entries to record the selected transactions
described below:
(a)
Issued $2,790,000 of 5-year,...
asked 13 minutes ago -
Using technology to support HR activities increases:
a.
the efficiency of the administrative HR functions.
b....
asked 14 minutes ago -
1. List the features used to classify leaf
types.
2. List some characteristics that are shared...
asked 19 minutes ago -
The three elements of Value Proposition, Key Customers, and
Capabilities operate within an environment. Which of...
asked 21 minutes ago -
Katelynn, a physician, earns $200,000 from her medical practice
in the current year. She receives $45,000...
asked 29 minutes ago -
Each row of the table below describes an aqueous solution at
25°C
.
The second column...
asked 33 minutes ago -
A horizontal wire is at y = 0. Current travels in the +x
direction. The magnetic...
asked 34 minutes ago -
Let X be a continuous random variable whose PDF is Let X be a
continuous random...
asked 55 minutes ago -
Martinez Company’s relevant range of production is 7,500 units
to 12,500 units. When it produces and...
asked 53 minutes ago -
A football with a mass of 1.2 kg is kicked from ground level to
a height...
asked 58 minutes ago -
Remember: Changes in supply determinants shift supply, and
changes in demand determinants shift demand. We say...
asked 57 minutes ago