Rothamsted Experimental Station (England) has studied wheat production since 1852. Each year, many small plots of...
Rothamsted Experimental Station (England) has studied wheat production since 1852. Each year, many small plots of equal size but different soil/fertilizer conditions are planted with wheat. At the end of the growing season, the yield (in pounds) of the wheat on the plot is measured. For a random sample of years, one plot gave the following annual wheat production (in pounds).
| 4.29 | 3.90 | 3.99 | 3.87 | 4.29 | 3.79 | 4.09 | 4.42 |
| 3.89 | 3.87 | 4.12 | 3.09 | 4.86 | 2.90 | 5.01 | 3.39 |
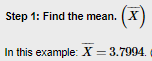
Use a calculator to verify that, for this plot, the sample
variance is s2 ≈ 0.309.
Another random sample of years for a second plot gave the following
annual wheat production (in pounds).
| 3.58 | 3.70 | 3.85 | 3.40 | 3.79 | 3.72 | 4.13 | 4.01 |
| 3.59 | 4.29 | 3.78 | 3.19 | 3.84 | 3.91 | 3.66 | 4.35 |
Use a calculator to verify that the sample variance for this
plot is s2 ≈ 0.092.
Test the claim that the population variance of annual wheat
production for the first plot is larger than that for the second
plot. Use a 1% level of significance.
(a) What is the level of significance?
State the null and alternate hypotheses.
Ho: σ12 = σ22; H1: σ12 > σ22Ho: σ12 > σ22; H1: σ12 = σ22 Ho: σ22 = σ12; H1: σ22 > σ12Ho: σ12 = σ22; H1: σ12 ≠ σ22
(b) Find the value of the sample F statistic. (Use 2
decimal places.)
What are the degrees of freedom?
| dfN | |
| dfD |
What assumptions are you making about the original distribution?
The populations follow dependent normal distributions. We have random samples from each population.The populations follow independent chi-square distributions. We have random samples from each population. The populations follow independent normal distributions. We have random samples from each population.The populations follow independent normal distributions.
(c) Find or estimate the P-value of the sample test
statistic. (Use 4 decimal places.)
p-value > 0.1000.050 < p-value < 0.100 0.025 < p-value < 0.0500.010 < p-value < 0.0250.001 < p-value < 0.010p-value < 0.001
(d) Based on your answers in parts (a) to (c), will you reject or
fail to reject the null hypothesis?
At the α = 0.01 level, we reject the null hypothesis and conclude the data are not statistically significant.At the α = 0.01 level, we reject the null hypothesis and conclude the data are statistically significant. At the α = 0.01 level, we fail to reject the null hypothesis and conclude the data are not statistically significant.At the α = 0.01 level, we fail to reject the null hypothesis and conclude the data are statistically significant.
(e) Interpret your conclusion in the context of the
application.
Fail to reject the null hypothesis, there is sufficient evidence that the variance in annual wheat production is greater in the first plot.Reject the null hypothesis, there is insufficient evidence that the variance in annual wheat production is greater in the first plot. Reject the null hypothesis, there is sufficient evidence that the variance in annual wheat production is greater in the first plot.Fail to reject the null hypothesis, there is insufficient evidence that the variance in annual wheat production is greater in the first plot.
Homework Answers
Variance Calculation First Plot:

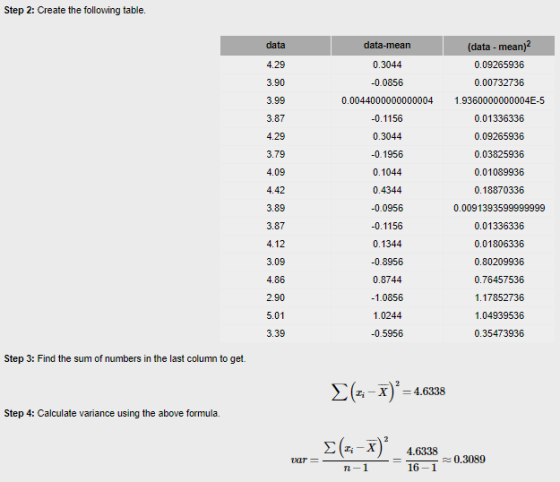
Thus, s12 ≈ 0.309
Variance Calculation Second Plot:

Thus, s22 ≈ 0.092
Answer a)
The level of significance = 0.01
The null and alternate hypotheses are as follows:
Ho: σ12 = σ22;
H1: σ12 > σ22
Here, σ12 = population variance of annual wheat production for the first plot and σ2 = population variance of annual wheat production for the second plot
Answer b)
Test Statistics
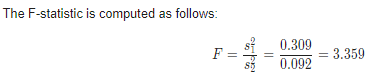
The value of the sample F statistic is 3.36
The degrees of freedom are
dfN = n1 - 1 = 16 - 1 = 15
dfD = n2 - 1 = 16 - 1 = 15
Assumptions
We have random samples from each population.
The populations follow independent normal distributions.
Answer c)
The p-value corresponding to F(15,15) = 3.359 is 0.0124 (Obtained using online calculator. Screenshot attached)
Thus, correct option is 0.010 < p-value < 0.025

Answer d)
Since p-value (0.0124) > α = 0.01, we fail to reject null hypothesis.
Thus,
At the α = 0.01 level, we fail to reject the null hypothesis and conclude the data are not statistically significant
Answer e)
Interpretation
Fail to reject the null hypothesis, there is insufficient evidence that the variance in annual wheat production is greater in the first plot.
Add Answer to:
Rothamsted Experimental Station (England) has studied wheat
production since 1852. Each year, many small plots of...
Two plots at Rothamsted Experimental Station were studied for production of wheat straw. For a ra...
Two plots at Rothamsted Experimental Station were studied for production of wheat straw. For a random sample of years, the annual wheat straw production (in pounds) from one plot was as follows. 6.96 7.10 5.84 5.91 7.31 7.18 7.06 5.79 6.24 5.91 6.14 Use a calculator to verify that, for this plot, the sample variance is s2 ≈ 0.384. Another random sample of years for a second plot gave the following annual wheat production (in pounds). 5.91 5.91 5.91 5.91...
Two plots at Rothamsted Experimental Station were studied for production of wheat straw. For a random sample of years, the annual wheat straw production (in pounds) from one plot was as follows. 6....
Two plots at Rothamsted Experimental Station were studied for production of wheat straw. For a random sample of years, the annual wheat straw production (in pounds) from one plot was as follows. 6.33 5.84 5.98 5.77 7.31 7.18 7.06 5.79 6.24 5.91 6.14 Use a calculator to verify that, for this plot, the sample variance is s2 ≈ 0.340. Another random sample of years for a second plot gave the following annual wheat production (in pounds). 5.91 5.77 6.47 6.75...
An economist wonders if corporate productivity in some countries is more volatile than in other countries....
An economist wonders if corporate productivity in some countries is more volatile than in other countries. One measure of a company's productivity is annual percentage yield based on total company assets. A random sample of leading companies in France gave the following percentage yields based on assets. 4.2 5.5 3.6 3.9 2.7 3.5 2.8 4.4 5.7 3.4 4.1 6.8 2.9 3.2 7.2 6.5 5.0 3.3 2.8 2.5 4.5 Use a calculator to verify that the sample variance is s2 ≈...
A random sample of leading companies in South Korea gave the following percentage yields based on...
A random sample of leading companies in South Korea gave the following percentage yields based on assets. 2.1 2.3 4.2 1.9 0.5 3.6 2.4 0.2 1.7 1.8 1.4 5.4 1.1 Use a calculator to verify that s2 ≈ 2.125 for these South Korean companies. Another random sample of leading companies in Sweden gave the following percentage yields based on assets. 2.2 3.8 3.9 1.1 3.9 2.8 2.3 3.5 2.8 Use a calculator to verify that s2 ≈ 0.909 for these...
A new thermostat has been engineered for the frozen food cases in large supermarkets. Both the...
A new thermostat has been engineered for the frozen food cases in large supermarkets. Both the old and new thermostats hold temperatures at an average of 25°F. However, it is hoped that the new thermostat might be more dependable in the sense that it will hold temperatures closer to 25°F. One frozen food case was equipped with the new thermostat, and a random sample of 26 temperature readings gave a sample variance of 5.2. Another similar frozen food case was...
A new thermostat has been engineered for the frozen food cases in large supermarkets. Both the...
A new thermostat has been engineered for the frozen food cases in large supermarkets. Both the old and new thermostats hold temperatures at an average of 25°F. However, it is hoped that the new thermostat might be more dependable in the sense that it will hold temperatures closer to 25°F. One frozen food case was equipped with the new thermostat, and a random sample of 21 temperature readings gave a sample variance of 5.2. Another similar frozen food case was...
A new fuel injection system has been engineered for pickup trucks. The new system and the...
A new fuel injection system has been engineered for pickup trucks. The new system and the old system both produce about the same average miles per gallon. However, engineers question which system (old or new) will give better consistency in fuel consumption (miles per gallon) under a variety of driving conditions. A random sample of 41 trucks was fitted with the new fuel injection system and driven under different conditions. For these trucks, the sample variance of gasoline consumption was...
A new fuel injection system has been engineered for pickup trucks. The new system and the...
A new fuel injection system has been engineered for pickup trucks. The new system and the old system both produce about the same average miles per gallon. However, engineers question which system (old or new) will give better consistency in fuel consumption (miles per gallon) under a variety of driving conditions. A random sample of 31 trucks were fitted with the new fuel injection system and driven under different conditions. For these trucks, the sample variance of gasoline consumption was...
An economist wonders if corporate productivity in some countries is more volatile than in other countries....
An economist wonders if corporate productivity in some countries is more volatile than in other countries. One measure of a company's productivity is annual percentage yield based on total company assets. A random sample of leading companies in France gave the following percentage yields based on assets. 4.2 5.9 3.2 3.5 2.3 3.5 2.8 4.4 5.7 3.4 4.1 6.8 2.9 3.2 7.2 6.5 5.0 3.3 2.8 2.5 4.5 Use a calculator to verify that the sample variance is s2 ≈...
You don't need to be rich to buy a few shares in a mutual fund. The...
You don't need to be rich to buy a few shares in a mutual fund. The question is, how reliable are mutual funds as investments? This depends on the type of fund you buy. The following data are based on information taken from a mutual fund guide available in most libraries. A random sample of percentage annual returns for mutual funds holding stocks in aggressive-growth small companies is shown below. -1.2 14.1 41.7 17.6 -16.7 4.4 32.6 -7.3 16.2 2.8...
Most questions answered within 3 hours.
-
By applying what you know about Grignard reagents and the
mechanism by which benzoic acid is...
asked 9 minutes ago -
For thermoplastics, explain the effects of increasing of each of
the following properties on a polymer’s...
asked 10 minutes ago -
Make a menu for the user to use in python 3 that can search and
replace...
asked 59 seconds ago -
1) An aqueous solution contains 0.280 M
NaHS and 0.128 M
H2S.
The pH of this...
asked 16 minutes ago -
Situational Leadership
is based on interplay of all of the following except:
The amount of guidance...
asked 16 minutes ago -
Consider the following problem: given n positive integers,
separate them into two groups such that adding...
asked 20 minutes ago -
Briefly discuss the following statements:
2.1 A partner never has the right to claim compensation for...
asked 22 minutes ago -
If a bond has an annual probability of default of 6%, 10% and
12% in years...
asked 31 minutes ago -
Let X be normally distributed with mean μ = 10 and standard
deviation σ = 6....
asked 36 minutes ago -
You're examining some of the tiny printing on one of the newer
twenty-dollar bills. A 1.5...
asked 41 minutes ago -
Discuss several common sources of secondary data coming from
government sources.
asked 43 minutes ago -
This is a basic java program where you convert units using only
loops, control statements and...
asked 44 minutes ago