MATLAB MATLAB MATLAB Model description The logistic map is a function that is often used to...
MATLAB MATLAB MATLAB
Model description The logistic map is a function that is often used to model population growth. It is defined by P(t+1) = rP(t) (1 -P(t)/K)
Here, P(t) represents the density of a population at year 1, the parameter r is a growth rate and the parameter K is the maximum possible population density (known as the carrying capacity). This equation says that if we know the density at one year, we can substitute it into the right-hand side to find the population at the next year. For instance, if we knew the population at year 0 (given by P(0)), we could then calculate
P(1) = rPO (1-P(0)/K)
Once we had the population density at year 1, we could then find the density at year 2 using
P(2) = rP(1)(1-P/K).
We can continue in this manner for as many steps as we want. (It is important to notice that we started counting time at t=0, not t= 1. This is a common choice in mathematical modeling, but it is not the way Matlab indexes vectors.)
For the rest of this problem, we will assume that P(0) = 8 and K = 20, but we will use various values of r.
Calculating population densities Suppose that r = 2.5. Calculate P(498), P(499) and P(500) and save them in that order) in a 1x3 row vector called ans1. Try plotting P VS t. You should see that the population density approaches a single value and stays there forever. This value of P is called a stable equilibrium or stable steady state of the logistic map. We say that the logistic map has a stable equilibrium when r = 2.5.
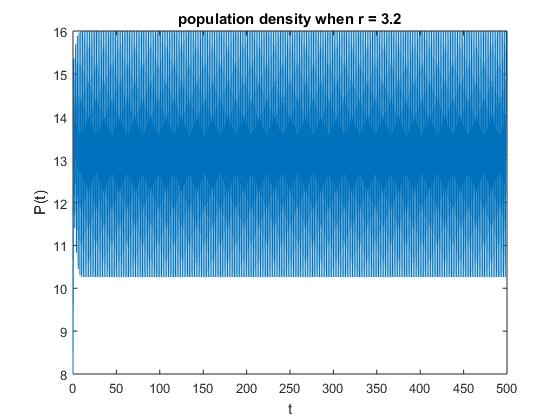
Repeat the same process with r = 3.2 and save the vector P 498), P (499), P(500) in a 1x3 row vector called ans2. Try plotting P vs t.
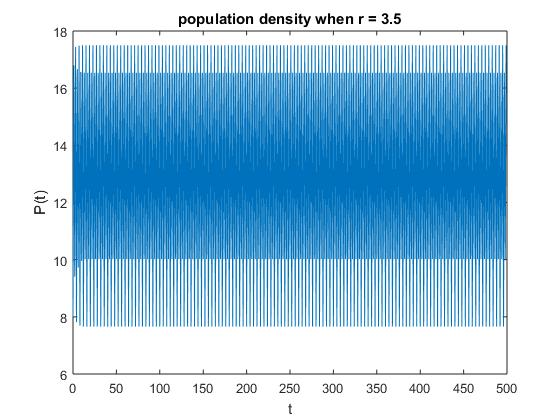
Similarly, repeat the same process with r= 3.5 and save the vector P 498), P (499),P(500) in 1x3 vector called ans3. Try plotting P vs t. In the latter two cases, you should see very different behavior. In particular, the population density should not approach a single value, so we say that the logistic map does not have a stable equilibrium for these values of r.
Homework Answers
PLEASE REFER BELOW CODE
close all
clear all
clc
%given data
P(1) = 8; %P(0) = 8
K = 20;
%at r=2.5
r = 2.5;
%given expression
%P(t+1) = rP(t)(1-P(t)/K)
%finding all values of P(t+1) for t=1 to 499
for t = 1:499
P(t+1) = r * P(t) * (1-(P(t)/K));
end
%size(P)
%collecting P(498), P(499) and P(500)
ans1 = [P(498) P(499) P(500)]
t = 0:499; %t vector
figure();
plot(t,P); %plotting P vs t
xlabel('t');
ylabel('P(t)');
title('population density when r = 2.5');
r = 3.2;
for t = 1:499
P(t+1) = r * P(t) * (1-(P(t)/K));
end
%size(P)
ans2 = [P(498) P(499) P(500)]
t = 0:499;
figure();
plot(t,P);
xlabel('t');
ylabel('P(t)');
title('population density when r = 3.2');
r = 3.5;
for t = 1:499
P(t+1) = r * P(t) * (1-(P(t)/K));
end
%size(P)
ans3 = [P(498) P(499) P(500)]
t = 0:499;
figure();
plot(t,P);
xlabel('t');
ylabel('P(t)');
title('population density when r = 3.5');
PLEASE REFER BELOW OUTPUT
ans1 =
12 12 12
ans2 =
15.9891 10.2609 15.9891
ans3 =
16.5388 10.0177 17.4999
>>

Add Answer to:
MATLAB MATLAB MATLAB
Model description The logistic map is a function that
is often used to...
4. In class you discussed a model for fishery management based on the logistic equation with...
 4. In class you discussed a model for fishery management based on the logistic equation with a parameterization of harvesting, N =EN (1-)-mN, N(0) = No where m is the fishing rate ("m" for mortality). With m = 0, there are two fixed points: Ni = 0 (unstable) and N = K (stable). With m > 0, the second fixed point becomes N = K(1 - m/r) <K (a) At what critical fishing rate, me, will the population die out?...
x'=r (1 - 2 / 2 x where r and K are positive constants, is called...
 x'=r (1 - 2 / 2 x where r and K are positive constants, is called the logistic equation. It is used in a number of scientific disciplines, but primarily (and historically) in population dynamics where z(t) is the size (numbers or density) of individuals in a biological population. For application to population dynamics ä(t) cannot be negative. If the solution (t) vanishes at some time, then we interpret this biologically as population extinction. (a) Draw the phase line portrait...
Growth Rate Function for Logistic Model The logistic growth model in the form of a growth function rather than an updating function is given by the equation Pu+ P+ gpn) Pn0.05 p, (1 0.0001 p) Assu...
 Growth Rate Function for Logistic Model The logistic growth model in the form of a growth function rather than an updating function is given by the equation Pu+ P+ gpn) Pn0.05 p, (1 0.0001 p) Assume that Po-500 and find the population for the next three hours Pt, p2, and p. Find the equilibria for this model. Is it stable or unstable? a. b. What is the value of carrying capacity? c. Find the p-intercepts and the vertex for -...
POPULATION MODELS: PLEASE ANSWSER ASAP: ALL 3 AND WILL RATE U ASAP. The logistic growth model...
 POPULATION MODELS: PLEASE
ANSWSER ASAP: ALL 3 AND WILL RATE U ASAP.
The logistic growth model describes population growth when
resources are constrained. It
is an extension to the exponential growth model that includes an
additional term introducing
the carrying capacity of the habitat.
The differential equation for this model is:
dP/dt=kP(t)(1-P(t)/M)
Where P(t) is the population (or population density) at time t,
k > 0 is a growth constant,
and M is the carrying capacity of the habitat. This...
POPULATION MODELS: PLEASE
ANSWSER ASAP: ALL 3 AND WILL RATE U ASAP.
The logistic growth model describes population growth when
resources are constrained. It
is an extension to the exponential growth model that includes an
additional term introducing
the carrying capacity of the habitat.
The differential equation for this model is:
dP/dt=kP(t)(1-P(t)/M)
Where P(t) is the population (or population density) at time t,
k > 0 is a growth constant,
and M is the carrying capacity of the habitat. This...
8. Scientists use the Logistic Growth P.K P(t) = function P. +(K-P.)e FC to model population...
 8. Scientists use the Logistic Growth P.K P(t) = function P. +(K-P.)e FC to model population growth where P. is the population at some reference point, K is the carrying capacity which is a theoretical upper bound of the population and ro is the base growth rate of the population. e. Find the growth rate function of the world population. Be sure to show all steps. f. Use technology to graph P'(t) on the interval [0, 100] > [0, 0.1]....
We go back to the logistic model for population dynamics (without harvesting), but we now allow t...
 part d please
We go back to the logistic model for population dynamics (without harvesting), but we now allow the growth rate and carrying capacity to vary in time: dt M(t) In this case the equation is not autonomous, so we can't use phase line analysis. We will instead find explicit analytical solutions (a) Show that the substitution z 1/P transforms the equation into the linear equation k (t) M(t) dz +k(t) dt (b) Using your result in (a), show...
part d please
We go back to the logistic model for population dynamics (without harvesting), but we now allow the growth rate and carrying capacity to vary in time: dt M(t) In this case the equation is not autonomous, so we can't use phase line analysis. We will instead find explicit analytical solutions (a) Show that the substitution z 1/P transforms the equation into the linear equation k (t) M(t) dz +k(t) dt (b) Using your result in (a), show...
please show all steps Consider the "doomsday" model: al = - rp (1 - 2 where...
 please show all steps
Consider the "doomsday" model: al = - rp (1 - 2 where r, K > 0. For what values of P(0) do we have that lim P(t) = 0, where T is a finite time called the "doomsday".
please show all steps
Consider the "doomsday" model: al = - rp (1 - 2 where r, K > 0. For what values of P(0) do we have that lim P(t) = 0, where T is a finite time called the "doomsday".
FF3:38 3A23B 57% . Grades (1 point) Hassell's model is often used to study populations of insects...
 FF3:38 3A23B 57% . Grades (1 point) Hassell's model is often used to study populations of insects. Suppose that the updating function for the population of a species of moth P in a sample plot is given by Problems 0.003P)2 Problem 1 Problem 2 Problem 3 Problem 4 Problem 5 Problem 6 Problem 7 Problem 8 Problem 9 Problem 10 Problem 11 Problem 12 Problem 13 Problem 14 Problem 15 Problem 16 Problem 17 Problem 18 Problem 19 Problem 20...
4. Consider the equation N,+1 = N, exp[r(1-N/K)] This equation is sometimes called an analog of...
 4. Consider the equation N,+1 = N, exp[r(1-N/K)] This equation is sometimes called an analog of the logistic differential equation (May, 1975). The equation models a single-species population growing in an environment that has a carrying capacity K. By this we mean that the environ- ment can only sustain a maximal population level N = K. The expression reflects a density dependence in the reproductive rate. To verify this observa- tion, consider the following steps: (a) Sketch A as a...
- ap-bp? This equation is known as the logistic law of population growth and the numbers...
 - ap-bp? This equation is known as the logistic law of population growth and the numbers a, b are called the vital coefficients of the population. It was first introduced in 1837 by the Dutch mathematical-biologist Verhulst. Now, the constant b, in general, will be very small compared to a, so that if p is not too large then the term - bp will be negligible compared to ap and the population will grow exponentially. However, when p is very...
 4. In class you discussed a model for fishery management based on the logistic equation with a parameterization of harvesting, N =EN (1-)-mN, N(0) = No where m is the fishing rate ("m" for mortality). With m = 0, there are two fixed points: Ni = 0 (unstable) and N = K (stable). With m > 0, the second fixed point becomes N = K(1 - m/r) <K (a) At what critical fishing rate, me, will the population die out?...
 x'=r (1 - 2 / 2 x where r and K are positive constants, is called the logistic equation. It is used in a number of scientific disciplines, but primarily (and historically) in population dynamics where z(t) is the size (numbers or density) of individuals in a biological population. For application to population dynamics ä(t) cannot be negative. If the solution (t) vanishes at some time, then we interpret this biologically as population extinction. (a) Draw the phase line portrait...
 Growth Rate Function for Logistic Model The logistic growth model in the form of a growth function rather than an updating function is given by the equation Pu+ P+ gpn) Pn0.05 p, (1 0.0001 p) Assume that Po-500 and find the population for the next three hours Pt, p2, and p. Find the equilibria for this model. Is it stable or unstable? a. b. What is the value of carrying capacity? c. Find the p-intercepts and the vertex for -...
 POPULATION MODELS: PLEASE
ANSWSER ASAP: ALL 3 AND WILL RATE U ASAP.
The logistic growth model describes population growth when
resources are constrained. It
is an extension to the exponential growth model that includes an
additional term introducing
the carrying capacity of the habitat.
The differential equation for this model is:
dP/dt=kP(t)(1-P(t)/M)
Where P(t) is the population (or population density) at time t,
k > 0 is a growth constant,
and M is the carrying capacity of the habitat. This...
POPULATION MODELS: PLEASE
ANSWSER ASAP: ALL 3 AND WILL RATE U ASAP.
The logistic growth model describes population growth when
resources are constrained. It
is an extension to the exponential growth model that includes an
additional term introducing
the carrying capacity of the habitat.
The differential equation for this model is:
dP/dt=kP(t)(1-P(t)/M)
Where P(t) is the population (or population density) at time t,
k > 0 is a growth constant,
and M is the carrying capacity of the habitat. This...
 8. Scientists use the Logistic Growth P.K P(t) = function P. +(K-P.)e FC to model population growth where P. is the population at some reference point, K is the carrying capacity which is a theoretical upper bound of the population and ro is the base growth rate of the population. e. Find the growth rate function of the world population. Be sure to show all steps. f. Use technology to graph P'(t) on the interval [0, 100] > [0, 0.1]....
 part d please
We go back to the logistic model for population dynamics (without harvesting), but we now allow the growth rate and carrying capacity to vary in time: dt M(t) In this case the equation is not autonomous, so we can't use phase line analysis. We will instead find explicit analytical solutions (a) Show that the substitution z 1/P transforms the equation into the linear equation k (t) M(t) dz +k(t) dt (b) Using your result in (a), show...
part d please
We go back to the logistic model for population dynamics (without harvesting), but we now allow the growth rate and carrying capacity to vary in time: dt M(t) In this case the equation is not autonomous, so we can't use phase line analysis. We will instead find explicit analytical solutions (a) Show that the substitution z 1/P transforms the equation into the linear equation k (t) M(t) dz +k(t) dt (b) Using your result in (a), show...
 please show all steps
Consider the "doomsday" model: al = - rp (1 - 2 where r, K > 0. For what values of P(0) do we have that lim P(t) = 0, where T is a finite time called the "doomsday".
please show all steps
Consider the "doomsday" model: al = - rp (1 - 2 where r, K > 0. For what values of P(0) do we have that lim P(t) = 0, where T is a finite time called the "doomsday".
 FF3:38 3A23B 57% . Grades (1 point) Hassell's model is often used to study populations of insects. Suppose that the updating function for the population of a species of moth P in a sample plot is given by Problems 0.003P)2 Problem 1 Problem 2 Problem 3 Problem 4 Problem 5 Problem 6 Problem 7 Problem 8 Problem 9 Problem 10 Problem 11 Problem 12 Problem 13 Problem 14 Problem 15 Problem 16 Problem 17 Problem 18 Problem 19 Problem 20...
 4. Consider the equation N,+1 = N, exp[r(1-N/K)] This equation is sometimes called an analog of the logistic differential equation (May, 1975). The equation models a single-species population growing in an environment that has a carrying capacity K. By this we mean that the environ- ment can only sustain a maximal population level N = K. The expression reflects a density dependence in the reproductive rate. To verify this observa- tion, consider the following steps: (a) Sketch A as a...
 - ap-bp? This equation is known as the logistic law of population growth and the numbers a, b are called the vital coefficients of the population. It was first introduced in 1837 by the Dutch mathematical-biologist Verhulst. Now, the constant b, in general, will be very small compared to a, so that if p is not too large then the term - bp will be negligible compared to ap and the population will grow exponentially. However, when p is very...
Most questions answered within 3 hours.
-
A sample of 100 units showed a sample mean 12 oz with a standard
deviation 3...
asked 1 minute from now -
Investors who find out what shares Warren Buffett, a famous
investor, is buying or selling to...
asked 12 minutes ago -
b) Compute the mean for all 5 Upper C 2 equals 10 samples with
size nequals2....
asked 18 minutes ago -
Giving a test to a group of students, the grades and gender are
summarized below A...
asked 22 minutes ago -
The ["VTP", "SNMP", "SMTP", "IPX"]
protocol is used by a collection of
switches...
asked 20 minutes ago -
MnO−4 reacts with
Fe2+ in acid solution to produce
Fe3+ and Mn2+. Write a balanced
equation...
asked 22 minutes ago -
Are some number of occupational illnesses and injuries an
acceptable part of doing business? Why or...
asked 45 minutes ago -
What is the Z score?
Use the following number to answer the question below:
X =...
asked 47 minutes ago -
The speed of the earth in its orbit is 29.8 km / s. Considering a displacement...
asked 51 minutes ago -
Find a source code of a program or developed software system.
You can select any source...
asked 50 minutes ago -
Suppose the events A and B have the property that P(B) = 0.5 and
P(A and...
asked 1 hour ago -
Consider a C function negMat(), that negates each element of a K
x K matrix y[][],...
asked 1 hour ago