Consider the following data: x : -7, -5, -1, 0, 2, 5, 6, .y: 15, 12...
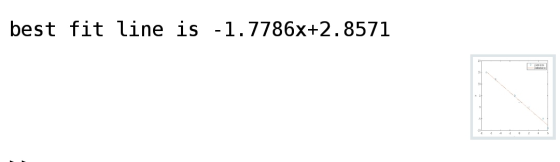
Consider the following data: x : -7, -5, -1, 0, 2, 5, 6, .y: 15, 12 ,5, 2, 0, -5, -9. Using linear regression find the equation in the form y=mx+b. b) Check your results for the coefficients in the trial function using a built-in function in Matlab, Python, or Mathematica. c) Plot the data points as dots and the best-fit line as a solid line on the same figure.
Homework Answers

MatLab program
clear all
clc
close all
% given data
x=[-7 -5 -1 0 2 5 6];
y=[15 12 5 2 0 -5 -9];
% fitting
p=polyfit(x,y,1);
m=p(1);
c=p(2);
% fitted data
x1=x;
y1=m*x1+c;
plot(x,y,'o',x1,y1)
xlabel('x');
ylabel('y');
legend('given data','plotted data')
fprintf('best fit line is %.4fx+%.4f',m,c);
Screenshot

Save the above program and execute it.
Result

I hope this will help you.
Add Answer to:
Consider the following data: x : -7, -5, -1, 0, 2, 5, 6, .y: 15,
12...
Using MATLAB, The following data is given: 13 14 15 15 2 10 12 (a) Use...
 Using MATLAB,
The following data is given: 13 14 15 15 2 10 12 (a) Use linear least-squares regression to determine the coefficients m and b in the function y - mx+b that best fits the data (b) Make a plot that shows the function and the data points.
Using MATLAB,
The following data is given: 13 14 15 15 2 10 12 (a) Use linear least-squares regression to determine the coefficients m and b in the function y - mx+b that best fits the data (b) Make a plot that shows the function and the data points.
please solve using matlab 4. Nonlinear Regression Fit the below data with the following curve-fit equation y bi (ebr + 2 1.0000 1.5431 3.7622 10.0677 27.3082 Define a function of the sum of squar...
 please solve using matlab
4. Nonlinear Regression Fit the below data with the following curve-fit equation y bi (ebr + 2 1.0000 1.5431 3.7622 10.0677 27.3082 Define a function of the sum of squared residuals (fSSR) as a function of the regression coefficients, b's. Minimize the fSSR function and determine the regression coefficients. Guess what would be the built-in math function to generate the original data? Plot the function in the existing figure with a smooth dashed line, calculate the...
please solve using matlab
4. Nonlinear Regression Fit the below data with the following curve-fit equation y bi (ebr + 2 1.0000 1.5431 3.7622 10.0677 27.3082 Define a function of the sum of squared residuals (fSSR) as a function of the regression coefficients, b's. Minimize the fSSR function and determine the regression coefficients. Guess what would be the built-in math function to generate the original data? Plot the function in the existing figure with a smooth dashed line, calculate the...
I need help with parts A B D E and F. Please show hand work for...
 I need help with parts A B D E and F. Please show hand work
for solving A and B while D and E should be matlab codes. How do i
pick the right graph for part F?
5 2 4 6 Linear spline: s fi+ (x-x) 2) Given the points 40 78 125 256 348 425 X1-x a) Write the correct linear spline equation to interpolate for x 4.72, simplifying where appropriate to get to the slope-intercept form. (4...
I need help with parts A B D E and F. Please show hand work
for solving A and B while D and E should be matlab codes. How do i
pick the right graph for part F?
5 2 4 6 Linear spline: s fi+ (x-x) 2) Given the points 40 78 125 256 348 425 X1-x a) Write the correct linear spline equation to interpolate for x 4.72, simplifying where appropriate to get to the slope-intercept form. (4...
Probability and Statistics 1. Linear Regression Given 4 data points: X Y 5 15 Use simple...
 Probability and Statistics
1. Linear Regression Given 4 data points: X Y 5 15 Use simple linear regression to estimate ßo and ß, for the best-fit line ỹ ß0 + ßqx Calculate these values: x | 7 | S | Spy | Bo | Big Sketch the regression line and the data points below
Probability and Statistics
1. Linear Regression Given 4 data points: X Y 5 15 Use simple linear regression to estimate ßo and ß, for the best-fit line ỹ ß0 + ßqx Calculate these values: x | 7 | S | Spy | Bo | Big Sketch the regression line and the data points below
2. Suppose Y ~ Exp(a), which has pdf f(y)-1 exp(-y/a). (a) Use the following R code to generate data from the model Yi...
 2. Suppose Y ~ Exp(a), which has pdf f(y)-1 exp(-y/a). (a) Use the following R code to generate data from the model Yi ~ Exp(0.05/Xi), and provide the scatterplot of Y against X set.seed(123) n <- 500 <-rnorm (n, x 3, 1) Y <- rexp(n, X) (b) Fit the model Yi-Ao + Ax, + ε¡ using the lm function in R and provide a plot of the best fit line on the scatterplot of Y vs X, and the residual...
1. Use Cramer's rule to solve this system. X + 4z = 2 2x + y...
 1. Use Cramer's rule to solve this system. X + 4z = 2 2x + y -z= 1 X +z=-1 on 910 2. Given the data points (0,), (1,3), (2,5) use the equation y=f(x) = mx +b to find the least square solution for best line fit. a. Evaluate the equation using the data points to obtain four linear equations. b. Write the system in 10a in a matrix form Ax=b. durants bhonebnih 516 10 boer word c. Write the...
Example 1: Least Squares Fit to a Data Set by a Linear Function. Compute the coefficients of the ...
 Example 1: Least Squares Fit to a Data Set by a Linear Function. Compute the coefficients of the best linear least-squares fit to the following data. x2.4 3.6 3.64 4.7 5.3 y| 33.8 34.7 35.5 36.0 37.5 38.1 Plot both the linear function and the data points on the same axis system Solution We can solve the problem with the following MATLAB commands x[2.4;3.6; 3.6;4.1;4.7;5.3]; y-L33.8;34.7;35.5;36.0;37.5;38.1 X [ones ( size (x)),x); % build the matrix X for linear model %...
use matlab 6. You have a x-y relationship as follows 1 2 3 4 5 6 7 8 10 X 17.52 22.76 24.22 36.83 37.65 51.32 68.3...
 use
matlab
6. You have a x-y relationship as follows 1 2 3 4 5 6 7 8 10 X 17.52 22.76 24.22 36.83 37.65 51.32 68.35 74.59 4.382 1.787 7.757 3nd order polynomial to curve-fit this relationship, i.e. We want to use a yaaxax +a^x (8) (a) Determine the coefficients of the polynomial by solving the following equation a (9) y's az a, (b) Determine the coefficients of the polynomial by using function polyfit (c) Make a plot showing...
use
matlab
6. You have a x-y relationship as follows 1 2 3 4 5 6 7 8 10 X 17.52 22.76 24.22 36.83 37.65 51.32 68.35 74.59 4.382 1.787 7.757 3nd order polynomial to curve-fit this relationship, i.e. We want to use a yaaxax +a^x (8) (a) Determine the coefficients of the polynomial by solving the following equation a (9) y's az a, (b) Determine the coefficients of the polynomial by using function polyfit (c) Make a plot showing...
3. Consider the following data for two variables, x and y. 4 5 4 6 4...
 3. Consider the following data for two variables, x and y. 4 5 4 6 4 6 9 5 11 a. Does there appear to be a linear relationship between x and y? Explain. b. Develop the estimated regression equation relating x and y. c. Plot the standardized residuals versus g for the estimated regression equation developed in part (b). Do the model assumptions appear to be satisfied? Explain. d. Perform a logarithmic transformation on the dependent variable y. Develop...
HW8_4 Fit the data in the table using linear regression. Plot the data points as well as the regr...
 Please write the codes in
MATLAB.
HW8_4 Fit the data in the table using linear regression. Plot the data points as well as the regression line. Determine the value of y whenx = 7.2 and print it to the screen using fprintf Then repeat the process, regressing in the opposite way (x vs y) to find the equation of the line needed to determine the value of x when y is 15 Optional brain food: Do you get the same...
Please write the codes in
MATLAB.
HW8_4 Fit the data in the table using linear regression. Plot the data points as well as the regression line. Determine the value of y whenx = 7.2 and print it to the screen using fprintf Then repeat the process, regressing in the opposite way (x vs y) to find the equation of the line needed to determine the value of x when y is 15 Optional brain food: Do you get the same...
 Using MATLAB,
The following data is given: 13 14 15 15 2 10 12 (a) Use linear least-squares regression to determine the coefficients m and b in the function y - mx+b that best fits the data (b) Make a plot that shows the function and the data points.
Using MATLAB,
The following data is given: 13 14 15 15 2 10 12 (a) Use linear least-squares regression to determine the coefficients m and b in the function y - mx+b that best fits the data (b) Make a plot that shows the function and the data points.
 please solve using matlab
4. Nonlinear Regression Fit the below data with the following curve-fit equation y bi (ebr + 2 1.0000 1.5431 3.7622 10.0677 27.3082 Define a function of the sum of squared residuals (fSSR) as a function of the regression coefficients, b's. Minimize the fSSR function and determine the regression coefficients. Guess what would be the built-in math function to generate the original data? Plot the function in the existing figure with a smooth dashed line, calculate the...
please solve using matlab
4. Nonlinear Regression Fit the below data with the following curve-fit equation y bi (ebr + 2 1.0000 1.5431 3.7622 10.0677 27.3082 Define a function of the sum of squared residuals (fSSR) as a function of the regression coefficients, b's. Minimize the fSSR function and determine the regression coefficients. Guess what would be the built-in math function to generate the original data? Plot the function in the existing figure with a smooth dashed line, calculate the...
 I need help with parts A B D E and F. Please show hand work
for solving A and B while D and E should be matlab codes. How do i
pick the right graph for part F?
5 2 4 6 Linear spline: s fi+ (x-x) 2) Given the points 40 78 125 256 348 425 X1-x a) Write the correct linear spline equation to interpolate for x 4.72, simplifying where appropriate to get to the slope-intercept form. (4...
I need help with parts A B D E and F. Please show hand work
for solving A and B while D and E should be matlab codes. How do i
pick the right graph for part F?
5 2 4 6 Linear spline: s fi+ (x-x) 2) Given the points 40 78 125 256 348 425 X1-x a) Write the correct linear spline equation to interpolate for x 4.72, simplifying where appropriate to get to the slope-intercept form. (4...
 Probability and Statistics
1. Linear Regression Given 4 data points: X Y 5 15 Use simple linear regression to estimate ßo and ß, for the best-fit line ỹ ß0 + ßqx Calculate these values: x | 7 | S | Spy | Bo | Big Sketch the regression line and the data points below
Probability and Statistics
1. Linear Regression Given 4 data points: X Y 5 15 Use simple linear regression to estimate ßo and ß, for the best-fit line ỹ ß0 + ßqx Calculate these values: x | 7 | S | Spy | Bo | Big Sketch the regression line and the data points below
 2. Suppose Y ~ Exp(a), which has pdf f(y)-1 exp(-y/a). (a) Use the following R code to generate data from the model Yi ~ Exp(0.05/Xi), and provide the scatterplot of Y against X set.seed(123) n <- 500 <-rnorm (n, x 3, 1) Y <- rexp(n, X) (b) Fit the model Yi-Ao + Ax, + ε¡ using the lm function in R and provide a plot of the best fit line on the scatterplot of Y vs X, and the residual...
 1. Use Cramer's rule to solve this system. X + 4z = 2 2x + y -z= 1 X +z=-1 on 910 2. Given the data points (0,), (1,3), (2,5) use the equation y=f(x) = mx +b to find the least square solution for best line fit. a. Evaluate the equation using the data points to obtain four linear equations. b. Write the system in 10a in a matrix form Ax=b. durants bhonebnih 516 10 boer word c. Write the...
 Example 1: Least Squares Fit to a Data Set by a Linear Function. Compute the coefficients of the best linear least-squares fit to the following data. x2.4 3.6 3.64 4.7 5.3 y| 33.8 34.7 35.5 36.0 37.5 38.1 Plot both the linear function and the data points on the same axis system Solution We can solve the problem with the following MATLAB commands x[2.4;3.6; 3.6;4.1;4.7;5.3]; y-L33.8;34.7;35.5;36.0;37.5;38.1 X [ones ( size (x)),x); % build the matrix X for linear model %...
 use
matlab
6. You have a x-y relationship as follows 1 2 3 4 5 6 7 8 10 X 17.52 22.76 24.22 36.83 37.65 51.32 68.35 74.59 4.382 1.787 7.757 3nd order polynomial to curve-fit this relationship, i.e. We want to use a yaaxax +a^x (8) (a) Determine the coefficients of the polynomial by solving the following equation a (9) y's az a, (b) Determine the coefficients of the polynomial by using function polyfit (c) Make a plot showing...
use
matlab
6. You have a x-y relationship as follows 1 2 3 4 5 6 7 8 10 X 17.52 22.76 24.22 36.83 37.65 51.32 68.35 74.59 4.382 1.787 7.757 3nd order polynomial to curve-fit this relationship, i.e. We want to use a yaaxax +a^x (8) (a) Determine the coefficients of the polynomial by solving the following equation a (9) y's az a, (b) Determine the coefficients of the polynomial by using function polyfit (c) Make a plot showing...
 3. Consider the following data for two variables, x and y. 4 5 4 6 4 6 9 5 11 a. Does there appear to be a linear relationship between x and y? Explain. b. Develop the estimated regression equation relating x and y. c. Plot the standardized residuals versus g for the estimated regression equation developed in part (b). Do the model assumptions appear to be satisfied? Explain. d. Perform a logarithmic transformation on the dependent variable y. Develop...
 Please write the codes in
MATLAB.
HW8_4 Fit the data in the table using linear regression. Plot the data points as well as the regression line. Determine the value of y whenx = 7.2 and print it to the screen using fprintf Then repeat the process, regressing in the opposite way (x vs y) to find the equation of the line needed to determine the value of x when y is 15 Optional brain food: Do you get the same...
Please write the codes in
MATLAB.
HW8_4 Fit the data in the table using linear regression. Plot the data points as well as the regression line. Determine the value of y whenx = 7.2 and print it to the screen using fprintf Then repeat the process, regressing in the opposite way (x vs y) to find the equation of the line needed to determine the value of x when y is 15 Optional brain food: Do you get the same...
Most questions answered within 3 hours.
-
20% of all customers subscribe to phone service.
70% of all customers subscribe to internet service....
asked 23 minutes ago -
Brown Corporation makes four products in a single facility.
These products have the following unit product...
asked 6 minutes ago -
Write a program to solve the Josephus problem, with the following
modification:
Sample Input:
./a.out n...
asked 3 hours ago -
At the start of a CD it is spinning at a rate of 525 rpm
(revolutions...
asked 3 hours ago -
4. Without doing any calculations, predict whether the observed
∆T would increase, decrease or remain the...
asked 4 hours ago -
Based on the range, which of the following sets of scores has
the greatest variability? 3,...
asked 6 hours ago -
Ripples in a pond travel at a velocity of 3 m/s with one peak
passing a...
asked 5 hours ago -
A man stands on the roof of a building of height 13.0 mm and
throws a...
asked 6 hours ago -
The extent to which assets are financed by borrowed funds and
other liabilities is indicated by:...
asked 7 hours ago -
Explain in detail
Germany is the fifth largest economy
explain what goods and services Germany specializes...
asked 7 hours ago -
The density of platinum is 21.45 g/mL. If a cube of platinum
with a mass of...
asked 7 hours ago -
Accounts Receivable
Sales
A/R Posting
Extended Sales Invoice
Packing Slip
Compare invoice to packing slip 2...
asked 7 hours ago