Consider the following competing hypotheses: H0: ρxy ≥ 0 HA: ρxy < 0 The sample consists...
Consider the following competing hypotheses: H0: ρxy ≥ 0 HA: ρxy < 0 The sample consists of 30 observations and the sample correlation coefficient is –0.30. [You may find it useful to reference the t table.]
a-1. Calculate the value of the test statistic. (Round intermediate calculations to at least 4 decimal places and final answer to 3 decimal places.)
Homework Answers

Add Answer to:
Consider the following competing hypotheses: H0: ρxy ≥ 0 HA: ρxy
< 0 The sample consists...
Consider the following competing hypotheses: H0: ρxy = 0 HA: ρxy ≠ 0 The sample consists...
Consider the following competing hypotheses: H0: ρxy = 0 HA: ρxy ≠ 0 The sample consists of 27 observations and the sample correlation coefficient is 0.38. [You may find it useful to reference the t table.] a-1. Calculate the value of the test statistic. (Round intermediate calculations to at least 4 decimal places and final answer to 3 decimal places.) TEST STATISTIC: ________ a-2. Find the p-value. 0.02 p-value < 0.05 0.01 p-value < 0.02 p-value < 0.01 p-value 0.10...
Consider the following competing hypotheses: H0: ρxy ≥ 0 HA: ρxy < 0 The sample consists...
Consider the following competing hypotheses: H0: ρxy ≥ 0 HA: ρxy < 0 The sample consists of 34 observations and the sample correlation coefficient is –0.39. Use Table 2. a. Calculate the value of the test statistic. (Negative value should be indicated by a minus sign. Round intermediate calculations to at least 4 decimal places and final answer to 2 decimal places.) Test statistic b. Approximate the p-value. 0.01 < p-value < 0.025 p-value < 0.005 0.05 < p-value <...
Consider the following competing hypotheses: H0: ρxy ≥ 0 HA: ρxy < 0 The sample consists...
Consider the following competing hypotheses: H0: ρxy ≥ 0 HA: ρxy < 0 The sample consists of 30 observations and the sample correlation coefficient is –0.46. Use Table 2. a. Calculate the value of the test statistic. (Negative value should be indicated by a minus sign. Round intermediate calculations to at least 4 decimal places and final answer to 2 decimal places.) Test statistic b. Approximate the p-value. 0.005 < p-value < 0.01 p-value < 0.005 0.01 < p-value <...
Consider the following competing hypotheses: H0: ρxy = 0 HA: ρxy ≠ 0 The sample consists...
Consider the following competing hypotheses: H0: ρxy = 0 HA: ρxy ≠ 0 The sample consists of 18 observations and the sample correlation coefficient is 0.15.
Consider the following competing hypotheses: H0: ρxy ≥ 0 HA: ρxy < 0 The sample consists of 30 observations and the sample correlation coefficient is –0.46. [You may find it useful to reference t...
 Consider the following competing hypotheses:
H0: ρxy ≥ 0
HA: ρxy < 0
The sample consists of 30 observations and the sample correlation
coefficient is –0.46. [You may find it useful to reference
the t table.]
a-1. Calculate the value of the test statistic.
(Round intermediate calculations to at least 4 decimal
places and final answer to 3 decimal places.)
a-2. Find the p-value.
p-value < 0.01
p-value
0.10
0.05
p-value < 0.10
0.025
p-value < 0.05
0.01
p-value <...
Consider the following competing hypotheses:
H0: ρxy ≥ 0
HA: ρxy < 0
The sample consists of 30 observations and the sample correlation
coefficient is –0.46. [You may find it useful to reference
the t table.]
a-1. Calculate the value of the test statistic.
(Round intermediate calculations to at least 4 decimal
places and final answer to 3 decimal places.)
a-2. Find the p-value.
p-value < 0.01
p-value
0.10
0.05
p-value < 0.10
0.025
p-value < 0.05
0.01
p-value <...
Consider the following competing hypotheses: He: Pxy = 0 НА: Рxy = 0 The sample consists...
 Consider the following competing hypotheses: He: Pxy = 0 НА: Рxy = 0 The sample consists of 18 observations and the sample correlation coefficient is 0.15. (You may find it useful to reference the t table.) a-1. Calculate the value of the test statistic. (Round intermediate calculations to at least 4 decimal places and final answer to 3 decimal places.) Test statistic a-2. Find the p-value 0.05 s p-value <0.10 0.02 s p-value <0.05 0.01 s p value <0.02 pvalue...
Consider the following competing hypotheses: (You may find it useful to reference the appropriate table: z...
Consider the following competing hypotheses: (You may find it useful to reference the appropriate table: z table or t table) H0: μD ≥ 0; HA: μD < 0 d¯d¯ = −3.5, sD = 5.5, n = 21 The following results are obtained using matched samples from two normally distributed populations: a-1. Calculate the value of the test statistic, assuming that the sample difference is normally distributed. (Negative value should be indicated by a minus sign. Round intermediate calculations to at least...
Consider the following competing hypotheses: (You may find it useful to reference the appropriate table: z...
Consider the following competing hypotheses: (You may find it useful to reference the appropriate table: z table or t table) Hypotheses: H0: μD ≤ 2; HA: μD > 2 Sample results: d−d− = 5.6, sD = 6.2, n = 10 The following results are obtained using matched samples from two normally distributed populations: a. Calculate the value of the test statistic, assuming that the sample difference is normally distributed. (Round all intermediate calculations to at least 4 decimal places and...
Consider the following competing hypotheses and accompanying sample data drawn independently from normally distributed populations. (You...
Consider the following competing hypotheses and accompanying sample data drawn independently from normally distributed populations. (You may find it useful to reference the appropriate table: z table or t table) H0: μ1 − μ2 ≥ 0 HA: μ1 − μ2 < 0 x−1 x − 1 = 222 x−2 x − 2 = 253 s1 = 32 s2 = 26 n1 = 12 n2 = 12 a-1. Calculate the value of the test statistic under the assumption that the population...
Consider the following competing hypotheses and accompanying sample data drawn independently from normally distributed populations. (You may find it useful to reference the appropriate table: z table or t table)
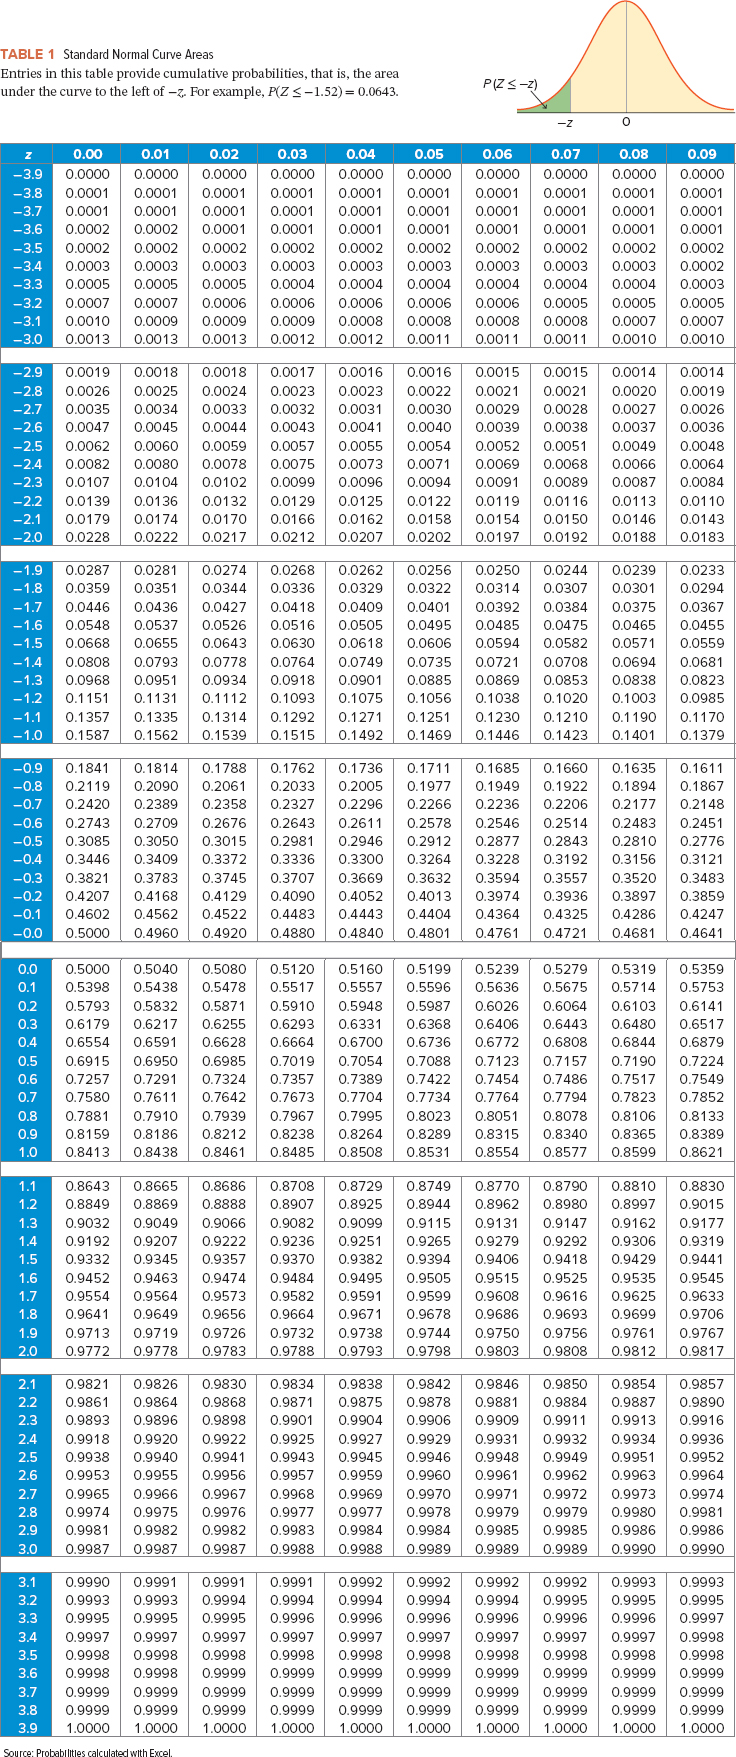 Consider the following competing hypotheses and accompanying sample data drawn independently from normally distributed populations. (You may find it useful to reference the appropriate table: z table or t table) H0: μ1 − μ2 = 0HA: μ1 − μ2 ≠ 0 x−1x−1 = 57x−2 = 63σ1 = 11.5σ2 = 15.2n1 = 20n2 = 20a-1. Calculate the value of the test statistic. (Negative values should be indicated by a minus sign. Round all intermediate calculations to at least 4 decimal places and final answer to 2 decimal places.)Test Statistic ?
 Consider the following competing hypotheses:
H0: ρxy ≥ 0
HA: ρxy < 0
The sample consists of 30 observations and the sample correlation
coefficient is –0.46. [You may find it useful to reference
the t table.]
a-1. Calculate the value of the test statistic.
(Round intermediate calculations to at least 4 decimal
places and final answer to 3 decimal places.)
a-2. Find the p-value.
p-value < 0.01
p-value
0.10
0.05
p-value < 0.10
0.025
p-value < 0.05
0.01
p-value <...
Consider the following competing hypotheses:
H0: ρxy ≥ 0
HA: ρxy < 0
The sample consists of 30 observations and the sample correlation
coefficient is –0.46. [You may find it useful to reference
the t table.]
a-1. Calculate the value of the test statistic.
(Round intermediate calculations to at least 4 decimal
places and final answer to 3 decimal places.)
a-2. Find the p-value.
p-value < 0.01
p-value
0.10
0.05
p-value < 0.10
0.025
p-value < 0.05
0.01
p-value <...
 Consider the following competing hypotheses: He: Pxy = 0 НА: Рxy = 0 The sample consists of 18 observations and the sample correlation coefficient is 0.15. (You may find it useful to reference the t table.) a-1. Calculate the value of the test statistic. (Round intermediate calculations to at least 4 decimal places and final answer to 3 decimal places.) Test statistic a-2. Find the p-value 0.05 s p-value <0.10 0.02 s p-value <0.05 0.01 s p value <0.02 pvalue...
Most questions answered within 3 hours.
-
The activation energy for a given reaction is 50.3 kJ/mol. If
the rate constant for the...
asked 37 minutes ago -
An entomologist discovers a dung beetle rolling a ball of dung
along the ground, and decides...
asked 2 hours ago -
Humans have used horses for transportation for millions of
years. Therefore, they will use horses for...
asked 4 hours ago -
The following are the Jensen Corporation's unit costs of making
and selling an item at a...
asked 4 hours ago -
Does direct Medicare reimbursement of Advanced practice nurses
increase access to their services?
asked 5 hours ago -
List and explain why a company would choose to use a
published
compensation survey vs. creating...
asked 5 hours ago -
A discrete random variable X can take values from 1 to 10. Find
the variance of...
asked 6 hours ago -
The primary financial goal of a corporation is to maximize:
shareholders wealth.
earnings per share.
stock...
asked 6 hours ago -
determine whether the vectors u=(1,2,3,), v=(-2,1,0) and
w=(1,0,1) are linearly dependent or independent.
asked 6 hours ago -
python
Define a function called print_values which takes a dictionary
object as a parameter. The function...
asked 7 hours ago -
In Chapter 1 you created a program named Triangle in
which you displayed a seven-line triangle...
asked 7 hours ago -
Research question: What are the differences between separately
stated and non separately stated transactions in an...
asked 7 hours ago