Standard solutions of ethanol in water were prepared and the density was measured with the pycnometer...
Standard solutions of ethanol in water were prepared and the density was measured with the pycnometer and the refractive index with the Abbé refractometer, from the following data indicate and justify Which of the two methods would you choose to determine ethanol in a sample whose concentration approximate is 5000 ppm
| % Ethanol, w/w | 0,0 | 0,5 | 1,0 | 2,0 | 4,0 |
| Density. g/ml | 0,9982 | 0,9973 | 0,9963 | 0,9945 | 0,9910 |
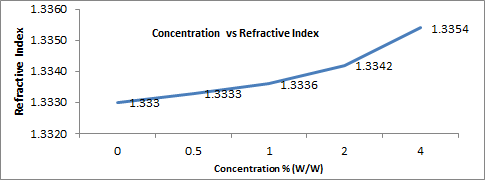
| Refractive index | 1,3330 | 1,3333 | 1,3336 | 1,3342 | 1,3354 |
Homework Answers
The plot of the standard curves according to the data given is as shown below. The concentration is assumed to be 0, 0.5, 1.0, 2.0, 4.0% instead of 0,0 0,5 1,0 2,0 4,0 as given in the table.

The concentration given in ppm is converted to percentage since the standard curves are prepared by concentration in %. The conversion is:
ppm is parts per million. 1ppm = 1/1000000 and 1% is 1/100 Hence 1ppm = 0.0001%
Hence 5000 ppm is 0.5%.
To determine the concentration of ethanol in a sample of ~5000 ppm, I would suggest to use the density method since the change in density with concentration is expressed in the third decimal digit in the case of Concentration-Density standard curve shown above. Whereas using the refractive index the changes are more pronounced in the higher concentration range from 1-4%.
Add Answer to:
Standard solutions of ethanol in water were prepared and the
density was measured with the pycnometer...
In Experiment 26 saturated solutions of barium iodate at equilibrium were prepared. A student carefully withdrew...
In Experiment 26 saturated solutions of barium iodate at equilibrium were prepared. A student carefully withdrew 5 mL from one of these solutions. That 5 mLs of solution was then treated with a reducing agent and its absorbance at 500nm was measured as 0.51. A Beer’s Law calibration curve showing the relationship between the concentration of IO3- and the absorbance of the treated solution, yielded a k = 380 M^-1 with an intercept through the origin (0,0). What is the...
Standard solutions of [Fe(SCN)2-] were prepared and their absorbance measured in order to study the Keq...
Standard solutions of [Fe(SCN)2-] were prepared and their absorbance measured in order to study the Keq for the reaction Fe3+ + SCN- <=> FeNCS2+ A plot of absorbance verses concentration of [Fe(SCN)2-] is shown below. To determine the Keq for the above reaction, 10.00 mL of 0.00200 M Fe(NO3)3 solution is mixed with 5.00 mL of 0.0020 M KSCN and diluted with 5.0 mL 0f 0.10 M HNO3. The absorbance of this red solution is found to be 0.322....
с Н А Р Т Е В 2 5 Urinalysis VOCABULARY REVIEW Assignment 25-1: Matching Match...
 с Н А Р Т Е В 2 5 Urinalysis VOCABULARY REVIEW Assignment 25-1: Matching Match the term with its definition and place the corresponding letter in the blank. 1. Turbid A. Point at which a substance reaches a concentration high enough for it to spill over into the urine 2. Urochrome B. Opaque, or unable to see through the urine specimen - 3. pH C. Snctures formed in urine due to the accumulation of protein, cells and fats in...
 с Н А Р Т Е В 2 5 Urinalysis VOCABULARY REVIEW Assignment 25-1: Matching Match the term with its definition and place the corresponding letter in the blank. 1. Turbid A. Point at which a substance reaches a concentration high enough for it to spill over into the urine 2. Urochrome B. Opaque, or unable to see through the urine specimen - 3. pH C. Snctures formed in urine due to the accumulation of protein, cells and fats in...
Most questions answered within 3 hours.
-
Given X ~ Exp(1/8), we survey 100 at a time and are interested
in the distribution...
asked 14 minutes ago -
The size of an array declaration must be know by the computer at
_______ time.
runtime...
asked 4 minutes ago -
Discuss at least two examples of scientific methods in
Biology
asked 9 minutes ago -
At a point high in the Earth's atmosphere, He2+ ions in a
concentration of 2.7×10¹²/m3 are...
asked 22 minutes ago -
Two small, identical conducting spheres repel each other with a
force of 0.025 N when they...
asked 19 minutes ago -
a rock is sliding down a hill. Assume that the hill is 20 meters
high and...
asked 22 minutes ago -
You’ve observed the following returns on Yamauchi Corporation’s
stock over the past five years: –28.8 percent,...
asked 24 minutes ago -
Is pursuit of a single-payer system the solution to workforce
challenges? Why or why not? What...
asked 21 minutes ago -
Consider this code below. If this is correct, explain how it
works. If it is not...
asked 23 minutes ago -
Given the pKa values of Lysine (2.2, 9.0 and 10.5), what is
the net charge of...
asked 29 minutes ago -
Which of the following descriptions of correlation is
correct?
Group of answer choices
a) Correlation equals...
asked 31 minutes ago -
Which of the following answers complete the sentence
correctly?
The pyruvate dehydrogenase complex is activated by:...
asked 31 minutes ago