Subgroup X1 X2 X3 X4 X R 1 98.4 98.6 98.3 98.7 98.5 0.4 2 97.5...
|
Subgroup |
X1 |
X2 |
X3 |
X4 |
X |
R |
|
1 |
98.4 |
98.6 |
98.3 |
98.7 |
98.5 |
0.4 |
|
2 |
97.5 |
97.6 |
98.0 |
97.6 |
97.7 |
0.5 |
|
3 |
98.8 |
98.9 |
98.4 |
98.7 |
98.7 |
0.5 |
|
4 |
99.1 |
99.3 |
99.4 |
99.2 |
99.3 |
0.3 |
|
5 |
97.8 |
98.0 |
98.2 |
98.0 |
98.0 |
0.4 |
|
6 |
98.3 |
98.5 |
98.5 |
98.5 |
98.5 |
0.2 |
|
7 |
98.9 |
99.0 |
98.6 |
99.0 |
98.9 |
0.4 |
|
8 |
97.5 |
97.7 |
97.6 |
97.9 |
97.7 |
0.4 |
|
9 |
99.3 |
99.3 |
99.2 |
99.4 |
99.3 |
0.2 |
|
10 |
98.5 |
98.7 |
98.7 |
98.3 |
98.6 |
0.4 |
a. You are running a batch reactor. Each batch takes about four hours to run. You measure the purity of the batch four times in the last hour to ensure that it has stabilized. You want to monitor the results using an X-R chart. The data you have collected for the first 10 batches are given the table below. X1, X2, X3 and X4 are the four samples you pull from the batch in the last hour. Using all the data, find trial control limits for and R charts, construct the chart, and plot the data. a. You are running a batch reactor. Each batch takes about four hours to run. You measure the purity of the batch four times in the last hour to ensure that it has stabilized. You want to monitor the results using an X-R chart. The data you have collected for the first 10 batches are given the table below. X1, X2, X3 and X4 are the four samples you pull from the batch in the last hour. Using all the data, find trial control limits for and R charts, construct the chart, and plot the data. a. You are running a batch reactor. Each batch takes about four hours to run. You measure the purity of the batch four times in the last hour to ensure that it has stabilized. You want to monitor the results using an X-R chart. The data you have collected for the first 10 batches are given the table below. X1, X2, X3 and X4 are the four samples you pull from the batch in the last hour. Using all the data, find trial control limits for and R charts, construct the chart, and plot the data. a. You are running a batch reactor. Each batch takes about four hours to run. You measure the purity of the batch four times in the last hour to ensure that it has stabilized. You want to monitor the results using an X-R chart. The data you have collected for the first 10 batches are given the table above. X1, X2, X3 and X4 are the four samples you pull from the batch in the last hour. Using all the data, find trial control limits for and R charts, construct the chart, and plot the data. Use Excel to answer the question.
b. Is the process in statistical control? Identify out-of-control points.
Homework Answers
(a) The calculations are:
| Sample size | 4 | |
| Number of samples | 10 | |
| Mean | Range | |
| Upper Control Limit, UCL | 98.767 | 0.844 |
| Center | 98.498 | 0.370 |
| Lower Control Limit, LCL | 98.228 | 0.000 |
The control charts are:
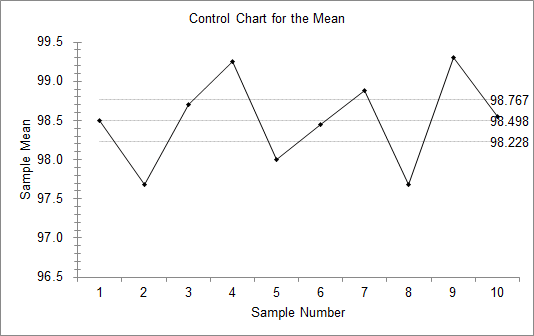
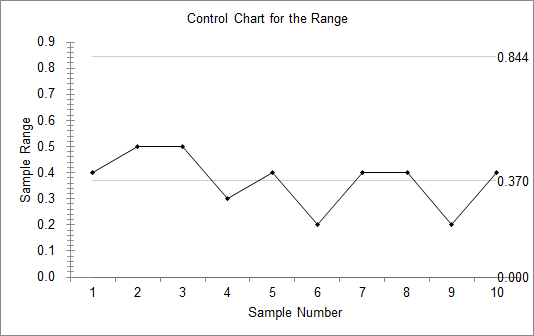
(b) The process is not in statistical control.
The out-of-control points are 97.675, 99.25, 98, 98.875, 97.675 & 99.3.
Compute the correlation coefficient, r, for all five variables (columns). Interpret your findings whether you have determined any relationship between variables. X1 X2 X3 X4 X5 The data (X1, X...
Compute the correlation coefficient, r, for all five variables (columns). Interpret your findings whether you have determined any relationship between variables. X1 X2 X3 X4 X5 The data (X1, X2, X3, X4, X5) are by city. 8 78 284 9.1 109 X1 = death rate per 1000 residents 9.3 68 433 8.7 144 X2 = doctor availability per 100,000 residents 7.5 70 739 7.2 113 X3 = hospital availability per 100,000 residents 8.9 96 1792 8.9 97 X4 = annual...
Most questions answered within 3 hours.
-
MAN3240 Organizational Behavior
In one to two paragraphs
6.) How can understanding emotions make me more...
asked 5 minutes ago -
Identify one individual who, in your opinion, is an excellent
leader. List the qualities that this...
asked 2 minutes ago -
For the data set shown below, complete parts (a) through (d)
below. x 3 4 5...
asked 8 minutes ago -
A university administrator working in student housing wants to
determine if the percentage of students residing...
asked 22 minutes ago -
3). Describe human population growth that has occurred in the
past 400 years. Use terms learned...
asked 19 minutes ago -
A
projectile is blue at a target. The distance from the point of
impact to the...
asked 44 minutes ago -
Given a 32 bit processor, with 2 MB of physical RAM split into 512
frames. What...
asked 34 minutes ago -
What were the main rulings in the Supreme Court cases which are
Morgan v. Virginia (1946)...
asked 33 minutes ago -
write a five paragraph essay on how setting,
specifically culture, influences the actions of
the characters...
asked 25 minutes ago -
JAVA
Provide a simple code sample of Merge sort
asked 36 minutes ago -
Discounting cash flows involves:
A. taking the cash discount offered on a trade merchandise
B. estimating...
asked 43 minutes ago -
A solid wood door 1.00 m wide and 2.00 m high is hinged along
one side...
asked 43 minutes ago