Justify your answer using standard partial equilibrium analysis. It is sufficient to show by graphs, but...
Justify your answer using standard partial equilibrium analysis. It is sufficient to show by graphs, but provide logical reasoning.
1. Analyze the effects of entry of a new firm. More precisely imagine there are I consumers and J producers. Assume all these are price takers. Now suppose one more producer enters into the market. What happens to
(a) Supply and demand curve
(b) Equilibrium price
(c) Surplus of incumbent firms
d) Consumer surplus
(e) Total surplus
Homework Answers
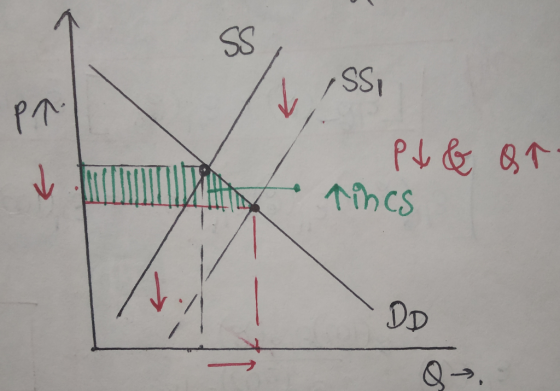
Supply curve shifts downwards to SS1
Eqm price falls & output rise
A) no effect on demand curve
Supply curve shifts to right , since one additional firm has entered
B) eqm price will fall, as Competition increase
C)surplus of incumbent firms fall, as eqm price in market falls
D) Consumer surplus rise, since price falls & eqm output rise
E) total surplus depends on whether increase in CS is greater than fall in PS or reverse.
If CS rises by more than fall in PS , then total surplus rise.
Otherwise it falls
Add Answer to:
Justify your answer using standard partial equilibrium analysis.
It is sufficient to show by graphs, but...
Problem Setup Analyze each of the following three scenarios (Efficient, A, and B) describing the market...
 Problem Setup
Analyze each of the following three scenarios (Efficient, A, and
B) describing the market for widgets.
Consider the market for widgets. Consumers have a market
(aggregate)
marginal benefit curve of MB = 50 – 3Q. The supplier(s) in that
market have a market (aggregate) marginal cost curve of MC = 10 +
2Q.
Efficient Outcome
● Use the marginal benefit and marginal cost equations given
above to determine the efficient quantity
Equilibrium with Marginal Cost Pricing (Scenario
A)...
Problem Setup
Analyze each of the following three scenarios (Efficient, A, and
B) describing the market for widgets.
Consider the market for widgets. Consumers have a market
(aggregate)
marginal benefit curve of MB = 50 – 3Q. The supplier(s) in that
market have a market (aggregate) marginal cost curve of MC = 10 +
2Q.
Efficient Outcome
● Use the marginal benefit and marginal cost equations given
above to determine the efficient quantity
Equilibrium with Marginal Cost Pricing (Scenario
A)...
Analyze the following three scenarios (Efficient, A, and B) describing the market for widgets. ● Consider...
Analyze the following three scenarios (Efficient, A, and B) describing the market for widgets. ● Consider the market for widgets, consumers have a market (aggregate) marginal benefit curve of MB = 90 – 2Q. The supplier(s) in that market have a market (aggregate) marginal cost curve of MC = 4Q. Efficient Outcome ● Use the marginal benefit and marginal cost equations given above to determine the efficient quantity (Q*) and the joint surplus (JS*) based on that quantity. Equilibrium with...
If a $5 tax on each pack of cigarettes causes the market price of cigarettes to...
 If a $5 tax on each pack of cigarettes causes the market price of cigarettes to increase by $2.50 then which of the following statements is true? consumers must be more elastic than producers consumers must be less elastic than producers consumers and producers must be equally elastic Question 42 (1 point) If the elasticity of demand is -1.8 and the elasticity of supply is 1, then consumers are than producers and the relative consumer burden will equal . Hint:...
Use the accompanying graph to answer these questions. a. Suppose demand is D and supply is...
 Use the accompanying graph to answer these questions.
a. Suppose demand is D and supply is S0. If a price
ceiling of $6 is imposed, what are the resulting shortage and full
economic price?
Shortage:
Full economic price: $
b. Suppose demand is D and supply is S0. If a price
floor of $12 is imposed, what is the resulting surplus? What is the
cost to the government of purchasing any and all unsold
units?
Surplus: units
Cost to government: $...
Use the accompanying graph to answer these questions.
a. Suppose demand is D and supply is S0. If a price
ceiling of $6 is imposed, what are the resulting shortage and full
economic price?
Shortage:
Full economic price: $
b. Suppose demand is D and supply is S0. If a price
floor of $12 is imposed, what is the resulting surplus? What is the
cost to the government of purchasing any and all unsold
units?
Surplus: units
Cost to government: $...
Graphs 1. Show using supply and demand analysis the areas that make up consumer surplus, producer...
 Graphs 1. Show using supply and demand analysis the areas that make up consumer surplus, producer surplus, and total surplus. 2. Show using supply and demand analysis the effect on total surplus if the government provides consumers with an income subsidy. 3. Show using supply and demand analysis the effect on total surplus if there is an increase in a products sales tax.
1. Suppose market demand for oranges is given by QD = 500 - 10P where Qp...
 1. Suppose market demand for oranges is given by QD = 500 - 10P where Qp is quantity demanded and P is the market price. Market supply is given by Qs = -100 + 10P where Qs is quantity supplied and P is the market price. (a) Find the equilibrium price and quantity in this market. (b) What is the consumer surplus and producer surplus? (C) Suppose that the government imposes a $10 tax on the good, to be included...
please give all the answers. dont need explanations too much 14. If a market is in...
 please give all the answers. dont need explanations too much
14. If a market is in equilibrium, then we know that price equals marginal cost because a. the market demand curve reflects marginal cost. b. marginal cost never changes. c. the market supply curve reflects marginal cost. d. every firm has the same costs. e. firms are required by law to equate marginal cost to price. 15. A positive externality raises a. marginal social benefits above marginal private benefits. b....
please give all the answers. dont need explanations too much
14. If a market is in equilibrium, then we know that price equals marginal cost because a. the market demand curve reflects marginal cost. b. marginal cost never changes. c. the market supply curve reflects marginal cost. d. every firm has the same costs. e. firms are required by law to equate marginal cost to price. 15. A positive externality raises a. marginal social benefits above marginal private benefits. b....
1. In partial equilibrium analysis in a product market, a single market is being examined in isolation to understand the relationship between: A. How a product's price coordinates economic transac...
1. In partial equilibrium analysis in a product market, a single market is being examined in isolation to understand the relationship between: A. How a product's price coordinates economic transactions between at least one consumer and at least one firm. B. How a product's price coordinates profit between at least one consumer and at least one firm. C. How a product's price coordinates cost between at least one consumer and at least one firm. D. How a product's price coordinates...
Use the linear demand and supply curves shown below to answer the following questions.You must show...
 Use the linear demand
and supply curves shown below to answer the following questions.You
must show all calculations step-by-step .
a) The market or equilibrium price is $__________.
b) When 10,000 units
are produced and consumed, total consumer surplus is $__________,
and total producer surplus is $__________.
c) At the market
price in part a, the net gain to consumers when 10,000
units are purchased is $__________.
d) At the market
price in part a, the net gain to producers...
Use the linear demand
and supply curves shown below to answer the following questions.You
must show all calculations step-by-step .
a) The market or equilibrium price is $__________.
b) When 10,000 units
are produced and consumed, total consumer surplus is $__________,
and total producer surplus is $__________.
c) At the market
price in part a, the net gain to consumers when 10,000
units are purchased is $__________.
d) At the market
price in part a, the net gain to producers...
Suppose the market for coffee is in equilibrium. Explain (using graphs) what would happen to the...
 Suppose the market for coffee is in equilibrium. Explain (using graphs) what would happen to the equilibrium price and equilibrium quantity of coffee in each of the following scenarios. Please place your final equilibrium effects on price and quantity in the SNoodle box below (ie. just say 'Equilibrium price increase/decreased etc and equilibrium quantity increased/decreased etc."). Be sure to put your graphical analysis on your scratch paper to be turned in. Credit will be given not only for the correct...
 Problem Setup
Analyze each of the following three scenarios (Efficient, A, and
B) describing the market for widgets.
Consider the market for widgets. Consumers have a market
(aggregate)
marginal benefit curve of MB = 50 – 3Q. The supplier(s) in that
market have a market (aggregate) marginal cost curve of MC = 10 +
2Q.
Efficient Outcome
● Use the marginal benefit and marginal cost equations given
above to determine the efficient quantity
Equilibrium with Marginal Cost Pricing (Scenario
A)...
Problem Setup
Analyze each of the following three scenarios (Efficient, A, and
B) describing the market for widgets.
Consider the market for widgets. Consumers have a market
(aggregate)
marginal benefit curve of MB = 50 – 3Q. The supplier(s) in that
market have a market (aggregate) marginal cost curve of MC = 10 +
2Q.
Efficient Outcome
● Use the marginal benefit and marginal cost equations given
above to determine the efficient quantity
Equilibrium with Marginal Cost Pricing (Scenario
A)...
 If a $5 tax on each pack of cigarettes causes the market price of cigarettes to increase by $2.50 then which of the following statements is true? consumers must be more elastic than producers consumers must be less elastic than producers consumers and producers must be equally elastic Question 42 (1 point) If the elasticity of demand is -1.8 and the elasticity of supply is 1, then consumers are than producers and the relative consumer burden will equal . Hint:...
 Use the accompanying graph to answer these questions.
a. Suppose demand is D and supply is S0. If a price
ceiling of $6 is imposed, what are the resulting shortage and full
economic price?
Shortage:
Full economic price: $
b. Suppose demand is D and supply is S0. If a price
floor of $12 is imposed, what is the resulting surplus? What is the
cost to the government of purchasing any and all unsold
units?
Surplus: units
Cost to government: $...
Use the accompanying graph to answer these questions.
a. Suppose demand is D and supply is S0. If a price
ceiling of $6 is imposed, what are the resulting shortage and full
economic price?
Shortage:
Full economic price: $
b. Suppose demand is D and supply is S0. If a price
floor of $12 is imposed, what is the resulting surplus? What is the
cost to the government of purchasing any and all unsold
units?
Surplus: units
Cost to government: $...
 Graphs 1. Show using supply and demand analysis the areas that make up consumer surplus, producer surplus, and total surplus. 2. Show using supply and demand analysis the effect on total surplus if the government provides consumers with an income subsidy. 3. Show using supply and demand analysis the effect on total surplus if there is an increase in a products sales tax.
 1. Suppose market demand for oranges is given by QD = 500 - 10P where Qp is quantity demanded and P is the market price. Market supply is given by Qs = -100 + 10P where Qs is quantity supplied and P is the market price. (a) Find the equilibrium price and quantity in this market. (b) What is the consumer surplus and producer surplus? (C) Suppose that the government imposes a $10 tax on the good, to be included...
 please give all the answers. dont need explanations too much
14. If a market is in equilibrium, then we know that price equals marginal cost because a. the market demand curve reflects marginal cost. b. marginal cost never changes. c. the market supply curve reflects marginal cost. d. every firm has the same costs. e. firms are required by law to equate marginal cost to price. 15. A positive externality raises a. marginal social benefits above marginal private benefits. b....
please give all the answers. dont need explanations too much
14. If a market is in equilibrium, then we know that price equals marginal cost because a. the market demand curve reflects marginal cost. b. marginal cost never changes. c. the market supply curve reflects marginal cost. d. every firm has the same costs. e. firms are required by law to equate marginal cost to price. 15. A positive externality raises a. marginal social benefits above marginal private benefits. b....
 Use the linear demand
and supply curves shown below to answer the following questions.You
must show all calculations step-by-step .
a) The market or equilibrium price is $__________.
b) When 10,000 units
are produced and consumed, total consumer surplus is $__________,
and total producer surplus is $__________.
c) At the market
price in part a, the net gain to consumers when 10,000
units are purchased is $__________.
d) At the market
price in part a, the net gain to producers...
Use the linear demand
and supply curves shown below to answer the following questions.You
must show all calculations step-by-step .
a) The market or equilibrium price is $__________.
b) When 10,000 units
are produced and consumed, total consumer surplus is $__________,
and total producer surplus is $__________.
c) At the market
price in part a, the net gain to consumers when 10,000
units are purchased is $__________.
d) At the market
price in part a, the net gain to producers...
 Suppose the market for coffee is in equilibrium. Explain (using graphs) what would happen to the equilibrium price and equilibrium quantity of coffee in each of the following scenarios. Please place your final equilibrium effects on price and quantity in the SNoodle box below (ie. just say 'Equilibrium price increase/decreased etc and equilibrium quantity increased/decreased etc."). Be sure to put your graphical analysis on your scratch paper to be turned in. Credit will be given not only for the correct...
Most questions answered within 3 hours.
-
From the literature (reference your sources): What are the
lattice parameters of calcite and aragonite? Why...
asked 32 minutes ago -
Your system is rejecting the question am asking which is
preceded by a case study. It...
asked 36 minutes ago -
3. On January 2, 2000, Larry creates a trust with himself as
trustee. Larry as trustee...
asked 33 minutes ago -
A member of the volleyball team spikes the ball. During this
process, she changes the velocity...
asked 40 minutes ago -
Are adult gamers less likely to use a gaming console (Xbox,
PlayStation, Wii, etc...) than teen...
asked 1 hour ago -
The University of
Texas recently reported that 43% of college students aged 18-24
would spend their...
asked 1 hour ago -
The length of stay at a specific emergency department in
Phoenix, Arizona, in 2009 had a...
asked 1 hour ago -
. Please give the mechanism for this type of problem. Step by
Step
The toxin that...
asked 1 hour ago -
If you have a 1M stock solution and you want to dilute 1 :10
with water,...
asked 1 hour ago -
In a load instruction, the effective address is obtained by
A) Retriving the address from a...
asked 1 hour ago -
Use the following information to answer this question.
Windswept, Inc. 2017 Income Statement ($ in millions)...
asked 1 hour ago -
A mutual fund salesperson has arranged to call on four people
tomorrow. Based on past experience...
asked 1 hour ago