A manufacturer wants to increase the shelf life of a line of cake mixes. Past records...
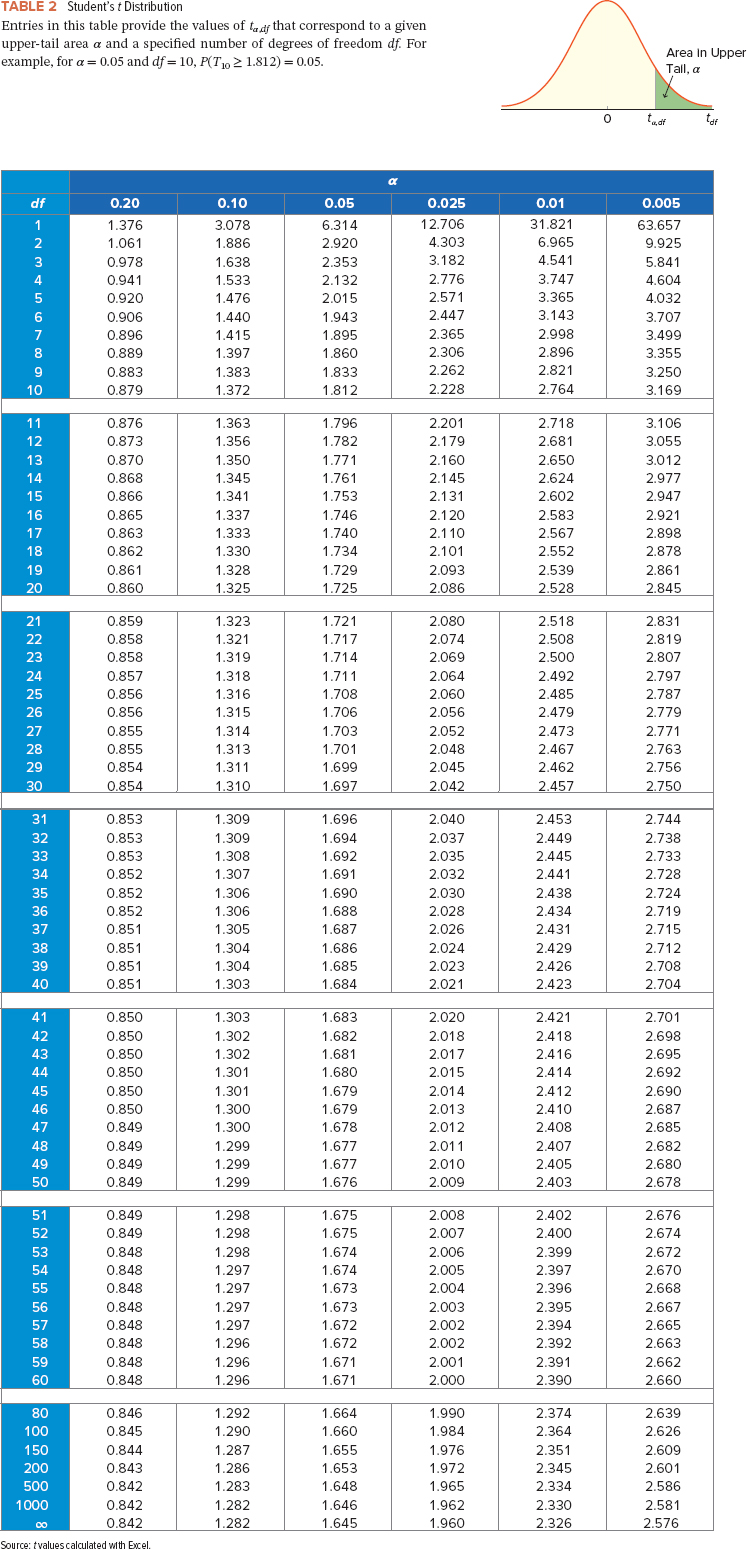
A manufacturer wants to increase the shelf life of a line of cake mixes. Past records indicate that the average shelf life of the mix is 216 days. After a revised mix has been developed, a sample of nine boxes of cake mix had a mean of 217.222 days and a standard deviation of 1.2019 days. What is the computed value of the test statistic?
Homework Answers
Solution:
Given in the question
Average shelf life of the mix(Population mean) = 216
Sample size (n) = 9
Sample mean = 217.222
Sample standard deviation = 1.2019
Test stat value can be calculated as
Test stat value = (Sample mean - Population mean)/Sample standard
deviation/sqrt(n)
Tets stat = (217.222 - 216)/1.2019/sqrt(9) = 1.222/0.4006 =
3.05
So Computed value of test statistic = 3.05
Add Answer to:
A manufacturer wants to increase the shelf life of a line of
cake mixes. Past records...
A manufacturer wants to increase the shelf life of a line of cake mixes. Past records...
A manufacturer wants to increase the shelf life of a line of cake mixes. Past records indicate that the average shelf life of the mix is 216 days. After a revised mix has been developed, a sample of nine boxes of cake mix gave these shelf lives (in days): 215, 217, 218, 219, 216, 217, 217, 218, and 218. Using α = 0.025, has the shelf life of the cake mix increased? - No, because computed t lies in the...
A manufacturer claims his light bulbs have a mean life of 1800 hours. A consumer group...
 A manufacturer claims his light bulbs have a mean life of 1800 hours. A consumer group wants to test if their light bulbs do not last as long as the manufacturer claims. They tested a random sample of 270 bulbs and found them to have a sample mean life of 1790 hours and a sample standard deviation of 60 hours. Assess the manufacturer's claim. a) What is the null hypothesis? Correct: y = 1800 Incorrect x = 1800 Incorrect x...
The mean life of a battery used in a digital clock is 305 days. The lives...
 The mean life of a battery used in a digital clock is 305 days. The lives of the batteries follow a normal distribution. The battery was recently modified to last longer. A sample of 20 of the modified batteries had a mean life of 308 days with a standard deviation of 12 days. A hypothesis test is undertaken to determine whether the modification increased the battery life. What is the value of the test statistic for the hypothesis test? In...
A manufacturer claims his light bulbs have a mean life of 2000 hours. A consumer group...
 A manufacturer claims his light bulbs have a mean life of 2000 hours. A consumer group wants to test if their light bulbs do not last as long as the manufacturer claims. They tested a random sample of 210 bulbs and found them to have a sample mean life of 1980 hours and a sample standard deviation of 50 hours. Assess the manufacturer's claim. a) What is the null hypothesis? Ou = 2000 O x = 2000 Ox< 2000 Ou...
A manufacturer claims his light bulbs have a mean life of 1800 hours. A consumer group...
 A manufacturer claims his light bulbs have a mean life of 1800 hours. A consumer group wants to test if their light bulbs do not last as long as the manufacturer claims. They tested a random sample of 230 bulbs and found them to have a sample mean life of 1790 hours and a sample standard deviation of 50 hours. Assess the manufacturer's claim. a) What is the null hypothesis? 正确:D=1800 错误x = 1800 错误x<1800 错误p> 1800 正确答案! 以前的尝试 您的证明编号是153-43332...
A phone manufacturer wants to compete in the touch screen phone market. Management understands that the leading product has a less than desirable battery life. They aim to compete with a new touch screen phone that is guaranteed to have a battery life mor
 A phone manufacturer wants to compete in the touch screen phone market. Management understands that the leading product has a less than desirable battery life. They aim to compete with a new touch screen phone that is guaranteed to have a battery life more than two hours longer than the leading product. A recent sample of 120 units of the leading product provides a mean battery life of 5 hours and 40 minutes with a standard deviation of 30 minutes. A...
Clearly choc -D size batteries produced by MNM Corporation have had a life expectancy of 87...
 Clearly choc -D size batteries produced by MNM Corporation have had a life expectancy of 87 hours. Because of an improved production process, it is believed that there has been an increase in the life expectancy of its size batteries. A sample of 36 batteries showed an average life of 88.5 hours. Assume from past information that it is known that the standard deviation of the population is 9 hours. What is the p-value associated with the sample results? Select...
The z-tests Help with this page is greatly appreciated. I dont understand how to show a full diagram. Thanks in advance :) The z-test 10.1 Assume that a treatment does have an effect and that th...
 The
z-tests
Help with this page is greatly appreciated. I dont understand
how to show a full diagram. Thanks in advance :)
The z-test 10.1 Assume that a treatment does have an effect and that the treatment effect is being evaluated with a z hypothesis test. If all factors are held constant, how is the outcome of the hypothesis test influenced by sample size? To answer this question, do the following two tests and compare the results. For both tests,...
The
z-tests
Help with this page is greatly appreciated. I dont understand
how to show a full diagram. Thanks in advance :)
The z-test 10.1 Assume that a treatment does have an effect and that the treatment effect is being evaluated with a z hypothesis test. If all factors are held constant, how is the outcome of the hypothesis test influenced by sample size? To answer this question, do the following two tests and compare the results. For both tests,...
photos for each question are all in a row (1 point) In the following questions, use...
 photos for each question are all in a row
(1 point) In the following questions, use the normal distribution to find a confidence interval for a difference in proportions pu - P2 given the relevant sample results. Give the best point estimate for p. - P2, the margin of error, and the confidence interval. Assume the results come from random samples. Give your answers to 4 decimal places. 300. Use 1. A 80% interval for pı - P2 given that...
photos for each question are all in a row
(1 point) In the following questions, use the normal distribution to find a confidence interval for a difference in proportions pu - P2 given the relevant sample results. Give the best point estimate for p. - P2, the margin of error, and the confidence interval. Assume the results come from random samples. Give your answers to 4 decimal places. 300. Use 1. A 80% interval for pı - P2 given that...
 A manufacturer claims his light bulbs have a mean life of 1800 hours. A consumer group wants to test if their light bulbs do not last as long as the manufacturer claims. They tested a random sample of 270 bulbs and found them to have a sample mean life of 1790 hours and a sample standard deviation of 60 hours. Assess the manufacturer's claim. a) What is the null hypothesis? Correct: y = 1800 Incorrect x = 1800 Incorrect x...
 The mean life of a battery used in a digital clock is 305 days. The lives of the batteries follow a normal distribution. The battery was recently modified to last longer. A sample of 20 of the modified batteries had a mean life of 308 days with a standard deviation of 12 days. A hypothesis test is undertaken to determine whether the modification increased the battery life. What is the value of the test statistic for the hypothesis test? In...
 A manufacturer claims his light bulbs have a mean life of 2000 hours. A consumer group wants to test if their light bulbs do not last as long as the manufacturer claims. They tested a random sample of 210 bulbs and found them to have a sample mean life of 1980 hours and a sample standard deviation of 50 hours. Assess the manufacturer's claim. a) What is the null hypothesis? Ou = 2000 O x = 2000 Ox< 2000 Ou...
 A manufacturer claims his light bulbs have a mean life of 1800 hours. A consumer group wants to test if their light bulbs do not last as long as the manufacturer claims. They tested a random sample of 230 bulbs and found them to have a sample mean life of 1790 hours and a sample standard deviation of 50 hours. Assess the manufacturer's claim. a) What is the null hypothesis? 正确:D=1800 错误x = 1800 错误x<1800 错误p> 1800 正确答案! 以前的尝试 您的证明编号是153-43332...
 Clearly choc -D size batteries produced by MNM Corporation have had a life expectancy of 87 hours. Because of an improved production process, it is believed that there has been an increase in the life expectancy of its size batteries. A sample of 36 batteries showed an average life of 88.5 hours. Assume from past information that it is known that the standard deviation of the population is 9 hours. What is the p-value associated with the sample results? Select...
 The
z-tests
Help with this page is greatly appreciated. I dont understand
how to show a full diagram. Thanks in advance :)
The z-test 10.1 Assume that a treatment does have an effect and that the treatment effect is being evaluated with a z hypothesis test. If all factors are held constant, how is the outcome of the hypothesis test influenced by sample size? To answer this question, do the following two tests and compare the results. For both tests,...
The
z-tests
Help with this page is greatly appreciated. I dont understand
how to show a full diagram. Thanks in advance :)
The z-test 10.1 Assume that a treatment does have an effect and that the treatment effect is being evaluated with a z hypothesis test. If all factors are held constant, how is the outcome of the hypothesis test influenced by sample size? To answer this question, do the following two tests and compare the results. For both tests,...
 photos for each question are all in a row
(1 point) In the following questions, use the normal distribution to find a confidence interval for a difference in proportions pu - P2 given the relevant sample results. Give the best point estimate for p. - P2, the margin of error, and the confidence interval. Assume the results come from random samples. Give your answers to 4 decimal places. 300. Use 1. A 80% interval for pı - P2 given that...
photos for each question are all in a row
(1 point) In the following questions, use the normal distribution to find a confidence interval for a difference in proportions pu - P2 given the relevant sample results. Give the best point estimate for p. - P2, the margin of error, and the confidence interval. Assume the results come from random samples. Give your answers to 4 decimal places. 300. Use 1. A 80% interval for pı - P2 given that...
Most questions answered within 3 hours.
-
Which statement is not correct?
Mutations change the sequence of nucleotides in DNA.
Mutations can be...
asked 29 minutes ago -
An organization is not required to accommodate an employee's
disability when the accommodation would cause "undue...
asked 29 minutes ago -
Mojo Mining has a bond outstanding that sells for $2,165 and
matures in 17 years. The...
asked 31 minutes ago -
Olympic weightlifter Zoe Smith holds a 58 kg barbell over her
head, 2.1 meters above the...
asked 34 minutes ago -
For sample average = 28 and a μ = 17 and a s = 4 and...
asked 44 minutes ago -
A
short forward contract that was negotiated some time ago will
expire in three months and...
asked 52 minutes ago -
If R = R1L2/L3, what is the measurement error dR based on the
rules of error...
asked 1 hour ago -
At equilibrium, the concentrations of N2(g),
O2 (g) and NO (g) in a sealed reaction vessel...
asked 1 hour ago -
Find P(X-bar > 15.5)
n=81, Mean=15, SD=1
asked 1 hour ago -
3. What percentage of search engine users don’t go to the next
page of search results?...
asked 1 hour ago -
Since Tanya Martin retired, she has used income from her
investment in the Alger Mid Cap...
asked 1 hour ago -
Determine the point estimate of the population proportion, the
margin of error for the following confidence...
asked 1 hour ago