Annual sales, in millions of dollars, for 21 pharmaceutical companies follow. 8,072 1,319 1,798 8,524 2,361...
Annual sales, in millions of dollars, for 21 pharmaceutical companies follow. 8,072 1,319 1,798 8,524 2,361 10,956 585 14,138 6,194 1,776 2,705 1,302 10,078 7,179 3,859 4,167 709 2,042 3,507 5,562 7,974 Provide a five-number summary. Smallest value First quartile Median Third quartile Largest value Compute the lower and upper limits. Lower limit Upper limit Do the data contain any outliers? Johnson & Johnson's sales are the largest on the list at $14,138 million. Suppose a data entry error (a transposition) had been made and the sales had been entered as $41,138 million. Would the method of detecting outliers in part (c) identify this problem and allow for correction of the data entry error? Which of the following box plots accurately displays the data set?
Homework Answers
The Descriptive Statistics for the data is as fallow
1) Descriptive Statistics: Annual sales
Variable Mean Minimum Q1 Median Q3 Maximum
Annual sales 4842 585 1782 3683 7849 14138
2) Following Box-plot Show that there is no outlier in the data

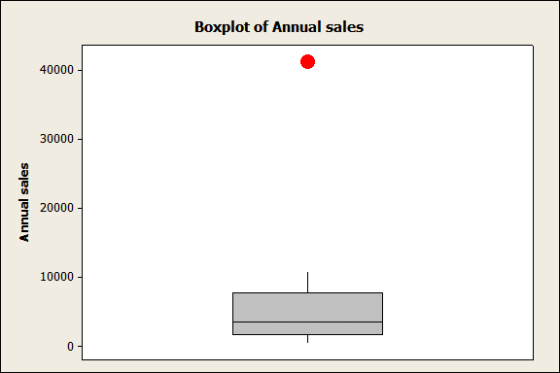
3) If the data for Johnson & Johnson's has been entered wrongly as 41,138 instead of 14,138 the following shows the outlier of the data. The red Dot shows the outlier of the data which is 41,138.
Among the two box plots first box plot accurately displays the data set.
Add Answer to:
Annual sales, in millions of dollars, for 21 pharmaceutical
companies follow. 8,072 1,319 1,798 8,524 2,361...
Annual salles, in millions of dolars, for 21 pharmaceutical companies follow 8,492 1,388 1,892 8,968 2,484 11,527 615 14,138 6,517 1,869 2,846 1,370 10,603 7,553 4,060 4,384 6 2,148 3,690 5,852 8...
 Annual salles, in millions of dolars, for 21 pharmaceutical companies follow 8,492 1,388 1,892 8,968 2,484 11,527 615 14,138 6,517 1,869 2,846 1,370 10,603 7,553 4,060 4,384 6 2,148 3,690 5,852 8,389 a. Provide a five number summary Smallest value First quartile Median Third quartile Largest value b. Compute the lower and upper limits (to 2 decimals). If required enter negative value as negative number Lower limit Upper limt c. Do the data contain any outliers? Select been entered as...
 Annual salles, in millions of dolars, for 21 pharmaceutical companies follow 8,492 1,388 1,892 8,968 2,484 11,527 615 14,138 6,517 1,869 2,846 1,370 10,603 7,553 4,060 4,384 6 2,148 3,690 5,852 8,389 a. Provide a five number summary Smallest value First quartile Median Third quartile Largest value b. Compute the lower and upper limits (to 2 decimals). If required enter negative value as negative number Lower limit Upper limt c. Do the data contain any outliers? Select been entered as...
Most questions answered within 3 hours.
-
Two buckets of mass 17.1 kg and 11.3 kg are attached to the ends
of a...
asked 9 minutes ago -
A laser used in LASIK eye surgery produces 50 pulses per second.
The wavelength is 192...
asked 7 minutes ago -
Smith Inc. recently reported operating income of $2.75 million,
depreciation of $1.20 million, and had a...
asked 7 minutes ago -
A
nurse is trying to understand the structure and chain of command of
a healthcare organization....
asked 10 minutes ago -
A company is interested in estimating the costs of lunch
in their cafeteria. After surveying employees,...
asked 14 minutes ago -
A woman expends 94 kJ of energy in walking a kilometer. The
energy is supplied by...
asked 25 minutes ago -
Our ability to see distinct edges as well as our errors in
contrast perceptions (e.g., seeing...
asked 16 minutes ago -
you want to measure the gravitational acceleration at your
location. since g does not vary significantly...
asked 30 minutes ago -
Aside from commercial tools that are specifically geared toward
TAR/PC( Technology-Assisted Review), are there potential
alternative...
asked 32 minutes ago -
the period of a pendulum on earth is 5 seconds. what will be the
period of...
asked 48 minutes ago -
The
act of turning media against itself, such as flash mobs and
billboard is called
a....
asked 44 minutes ago -
A set of length measurements are obtained with the values 165.6
± 0.3, 165.1± 0.4,166.4± 1.0,...
asked 45 minutes ago