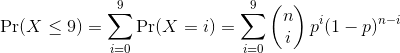
70% of people wear seat belts. If 20 people were randomly checked, find the probability that...
70% of people wear seat belts. If 20 people were randomly checked, find the probability that 9 or fewer were wearing seat belts. (Note: This is a binomial problem since people either wear seat belts or they don't.)
Homework Answers
P[ Person wearing seat belt ] = p = 70% = 0.7
The population proportion of success is p = 0.7, also, 1 - p = 1
- 0.7 = 0.3, and the sample size is n= 20. We need to compute

Therefore, we get that
This implies that


P[ Person wearing seat belt ] = p = 70% = 0.7
The population proportion of success is p = 0.7, also, 1 - p = 1
- 0.7 = 0.3, and the sample size is n= 20. We need to compute

Therefore, we get that

This implies that


Add Answer to:
70% of people wear seat belts. If 20 people were randomly
checked, find the probability that...
60% of people wear seat belts. If 14 people were randomly checked, find the probability that...
60% of people wear seat belts. If 14 people were randomly checked, find the probability that 8 or more were wearing seat belts.
Number of Cigarettes Smoked per Day 0 1-14 15-34 35 and over Wear Seat Belts 159...
 Number of Cigarettes Smoked per Day
0
1-14
15-34
35 and over
Wear Seat Belts
159
29
46
10
Don't wear seat belts
159
17
35
9
Test statistic?
P value?
Reject/fail to reject?
A study of seat belt users and nonusers yielded the randomly selected sample data summarized in the accompanying table. Use a 0.05 significance level to test the claim that the amount of smoking is independent of seat belt use. A plausible theory is that people who...
Number of Cigarettes Smoked per Day
0
1-14
15-34
35 and over
Wear Seat Belts
159
29
46
10
Don't wear seat belts
159
17
35
9
Test statistic?
P value?
Reject/fail to reject?
A study of seat belt users and nonusers yielded the randomly selected sample data summarized in the accompanying table. Use a 0.05 significance level to test the claim that the amount of smoking is independent of seat belt use. A plausible theory is that people who...
3 A study of seat belt users and nonusers yielded the randomly selected sample data summarized...
 3 A study of seat belt users and nonusers yielded the randomly selected sample data summarized in the accompanying table. Use a 0.05 significance level to test the claim that the amount of smoking is independent of seat belt use. A plausible theory is that people who smoke are less concerned about their health and safety and are therefore less inclined to wear seat belts. Is this theory supported by the sample data? B Click the icon to view the...
In a national survey college students were asked, "How often do you wear a seat belt...
 In a national survey college students were asked, "How often do you wear a seat belt when riding in a car driven by someone else?" The response frequencies appear in the table to the right. (a) Construct a probability model for seat-belt use by a passenger. (b) Would you consider it unusual to find a college student who never wears a seat belt when riding in a car driven by someone else? Response Frequency Never Sometimes Most of the time...
In a national survey college students were asked, "How often do you wear a seat belt...
In a national survey college students were asked, "How often do you wear a seat belt when riding in a car driven by someone else?" The response frequencies appear in the table to the right. (a) Construct a probability model for seat-belt use by a passenger. (b) Would you consider it unusual to find a college student who never wears a seat belt when riding in a car driven by someone else? Response Frequency Never 126 Rarely 346 Sometimes 535...
1. The birthday of six random people has been checked. Find the probability that (a) At...
1. The birthday of six random people has been checked. Find the probability that (a) At least one of them is born in September. (b) All five are born in the Spring. Spring here means one of the month March, April, or May. (c) At least two of them are born in the same month. In this problem you can assume that a year is 365 days. 2.A fair die is rolled three times. We say that a match has...
A Gallup poll found 57% of people were pro-choice on abortion. 1. Find the probability that...
A Gallup poll found 57% of people were pro-choice on abortion. 1. Find the probability that of the next 40 randomly sampled people that 25 (x = 25) are pro-choice 2. Find the probability that of the next 30 randomly sampled people that less than 15 (x ≤ 15) are pro-choice 3. Find the probability that of the next 50 randomly sampled people that between 20 and 30 (20 ≤ x ≤ 30)are pro-choice.
70% of all Americans live in cities with population greater than 100,000 people. If 35 Americans...
 70% of all Americans live in cities with population greater than 100,000 people. If 35 Americans are randomly selected find the probability that a. Exactly 24 of them live in cities with population greater than 100,000 people. b. At most 23 of them live in cities with population greater than 100,000 people. e. At least 26 of them live in cities with population greater than 100,000 people. d. Between 20 and 27 (including 20 and 27) of them live in...
A stadent asked Dr. Dars birthday at randomly. Find the probability that Dr. D APRIL (Ignore...
 A stadent asked Dr. Dars birthday at randomly. Find the probability that Dr. D APRIL (Ignore leap years) Dr. Dai's birthday is in APRIL) A) 30/365 (1) 31/365 i visin 30 C) 1/12 D) 28/365 32) Roll a pair of dice la red, a green). What is the probability that their face numbers are same! A) 7/36 B) 5/36 C) 1/6 DJ 5/6 Problems 33 through 38, given same information in Problem 35 33) Given X (37 44 18 53...
Question 6 5 pts Solve the problem. A recent study suggested that 70% of all eligible...
 Question 6 5 pts Solve the problem. A recent study suggested that 70% of all eligible voters will vote in the next presidential election. Suppose 20 eligible voters were randomly selected from the population of all eligible voters. Use a binomial probability table to find the probability that more than 12 of the eligible voters sampled will vote in the next presidential election. O 0.228 O 0.392 O 0.887 O 0.608 O 0.772 Question 7 5 pts Solve the problem....
 Number of Cigarettes Smoked per Day
0
1-14
15-34
35 and over
Wear Seat Belts
159
29
46
10
Don't wear seat belts
159
17
35
9
Test statistic?
P value?
Reject/fail to reject?
A study of seat belt users and nonusers yielded the randomly selected sample data summarized in the accompanying table. Use a 0.05 significance level to test the claim that the amount of smoking is independent of seat belt use. A plausible theory is that people who...
Number of Cigarettes Smoked per Day
0
1-14
15-34
35 and over
Wear Seat Belts
159
29
46
10
Don't wear seat belts
159
17
35
9
Test statistic?
P value?
Reject/fail to reject?
A study of seat belt users and nonusers yielded the randomly selected sample data summarized in the accompanying table. Use a 0.05 significance level to test the claim that the amount of smoking is independent of seat belt use. A plausible theory is that people who...
 3 A study of seat belt users and nonusers yielded the randomly selected sample data summarized in the accompanying table. Use a 0.05 significance level to test the claim that the amount of smoking is independent of seat belt use. A plausible theory is that people who smoke are less concerned about their health and safety and are therefore less inclined to wear seat belts. Is this theory supported by the sample data? B Click the icon to view the...
 In a national survey college students were asked, "How often do you wear a seat belt when riding in a car driven by someone else?" The response frequencies appear in the table to the right. (a) Construct a probability model for seat-belt use by a passenger. (b) Would you consider it unusual to find a college student who never wears a seat belt when riding in a car driven by someone else? Response Frequency Never Sometimes Most of the time...
 70% of all Americans live in cities with population greater than 100,000 people. If 35 Americans are randomly selected find the probability that a. Exactly 24 of them live in cities with population greater than 100,000 people. b. At most 23 of them live in cities with population greater than 100,000 people. e. At least 26 of them live in cities with population greater than 100,000 people. d. Between 20 and 27 (including 20 and 27) of them live in...
 A stadent asked Dr. Dars birthday at randomly. Find the probability that Dr. D APRIL (Ignore leap years) Dr. Dai's birthday is in APRIL) A) 30/365 (1) 31/365 i visin 30 C) 1/12 D) 28/365 32) Roll a pair of dice la red, a green). What is the probability that their face numbers are same! A) 7/36 B) 5/36 C) 1/6 DJ 5/6 Problems 33 through 38, given same information in Problem 35 33) Given X (37 44 18 53...
 Question 6 5 pts Solve the problem. A recent study suggested that 70% of all eligible voters will vote in the next presidential election. Suppose 20 eligible voters were randomly selected from the population of all eligible voters. Use a binomial probability table to find the probability that more than 12 of the eligible voters sampled will vote in the next presidential election. O 0.228 O 0.392 O 0.887 O 0.608 O 0.772 Question 7 5 pts Solve the problem....
Most questions answered within 3 hours.
-
if a firm producing 100 units at $5.00 each experience
an 80% experience curve, what will...
asked 23 minutes ago -
A solid, uniform disk of radius 0.250 m and mass 53.7 kg rolls
down a ramp...
asked 2 hours ago -
Given the following table of high speed internet access vs.
annual home income:
Home Income
%...
asked 3 hours ago -
A baseball batter hits a 0.145kg baseball straight up into the
air. The baseball leaves the...
asked 3 hours ago -
An FM modulator is tested using
single-tone baseband signal with frequency of 50kHz and a sprectrum...
asked 4 hours ago -
Write the ionic equations for the first stage of salts
hydrolysis.
Anion, Cation?
Na2S
NiSO4
K2SO4...
asked 5 hours ago -
suppose there is a normally distributed population with a mean of
250 and a standard deviation...
asked 6 hours ago -
Question Three
Suppose you as project manager are using the Waterfall
development methodology on a large...
asked 7 hours ago -
Which statement is not true about welfare in Canada?
A.Benefits typically vary based on one's ability...
asked 7 hours ago -
Please help me with FLOWCHART and UML diagram for class,
thank you!
#include <iostream>
#include <fstream>...
asked 8 hours ago -
3. Describe the “logic circuit” of the Lac operon. Which
proteins are bound or not to...
asked 8 hours ago -
Ayesha’s adjusted gross income is $60,000 in 2019. She donated a
piece of artwork with a...
asked 8 hours ago