A local retailer recently collected data on customers that frequent the store. The data are presented...
A local retailer recently collected data on customers that frequent the store. The data are presented in the table below
| Items | Net Sales | Gender | Age | |
| 1 | 59.25 | Male | 29 | |
| 1 | 153.6 | Female | 33 | |
| 1 | 33.75 | Female | 29 | |
| 5 | 150.6 | Female | 25 | |
| 2 | 81 | Female | 31 | |
| 1 | 66.75 | Female | 41 | |
| 2 | 117 | Female | 27 | |
| 1 | 33.75 | Female | 37 | |
| 2 | 84.78 | Female | 43 | |
| 1 | 66.75 | Female | 33 | |
| 1 | 44.25 | Female | 45 | |
| 1 | 47.4 | Female | 37 | |
| 9 | 240.6 | Female | 37 | |
| 2 | 96.75 | Female | 43 | |
| 1 | 74.25 | Male | 21 | |
| 2 | 107.1 | Male | 33 | |
| 3 | 141 | Female | 19 | |
| 3 | 81.75 | Female | 37 | |
| 2 | 57.75 | Female | 29 | |
| 6 | 67.2 | Female | 53 | |
| 1 | 47.4 | Female | 25 | |
| 4 | 106.23 | Female | 35 | |
| 7 | 399 | Female | 47 | |
| 2 | 111 | Female | 39 | |
| 2 | 59.25 | Male | 45 | |
| 1 | 45.03 | Female | 57 | |
| 1 | 66.75 | Female | 51 | |
| 5 | 289.2 | Female | 39 | |
| 3 | 106.8 | Female | 29 | |
| 1 | 27 | Female | 67 |
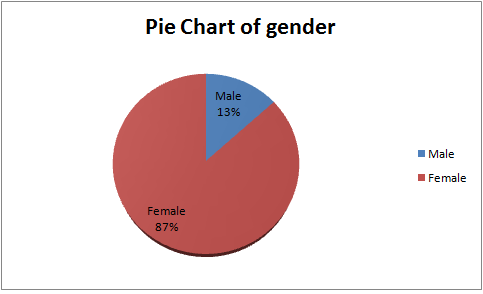
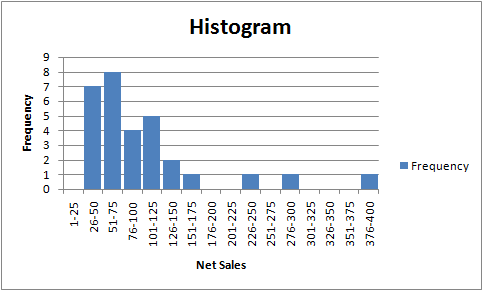
a. Develop a frequency distribution for the number of Items purchased. What is the probability that a customer will purchase 3 or fewer items? b. develop a frequency distribution and histogram for Net Sales using a class width of 25 (1-25, 26-50...). c. Use a pie chart to display the percentages of customers who are male or female. d. for the age data, determine the following: (1) mean: (2) Median (3) Mode (4) Interquartile range (5) 94nd percentile
Homework Answers
(a)
| Items | Frequency |
| 1 | 13 |
| 2 | 8 |
| 3 | 3 |
| 4 | 1 |
| 5 | 2 |
| 6 | 1 |
| 7 | 1 |
| 8 | 0 |
| 9 | 1 |
Here, total frequency = 30. Hence, required probability = (13 + 8 +
3) = 24/30 = 0.80.
(c) The pie chart is given below:
(b)
| Net Sales | Frequency |
| 1-25 | 0 |
| 26-50 | 7 |
| 51-75 | 8 |
| 76-100 | 4 |
| 101-125 | 5 |
| 126-150 | 2 |
| 151-175 | 1 |
| 176-200 | 0 |
| 201-225 | 0 |
| 226-250 | 1 |
| 251-275 | 0 |
| 276-300 | 1 |
| 301-325 | 0 |
| 326-350 | 0 |
| 351-375 | 0 |
| 376-400 | 1 |
(d) Mean = 37.2, Median = 37,
Mode = 29, IQR = Q3 - Q1 = 43 - 29 =
14, 94th percentile = 54.04.
Add Answer to:
A local retailer recently collected data on customers that
frequent the store. The data are presented...
Sample Data Sample Data Hour Sample Taken Hour Sample Taken 1 4 5 X 1 3...
 Sample Data Sample Data Hour Sample Taken Hour Sample Taken 1 4 5 X 1 3 1 42 2 3 4 5 6 2 39 36 25 60 28 53 22 56 41 34 43 45 59 42 36 40 45 39 48 26 42 34 61 48 45 29 3 31 61 38 40 54 26 38 42 37 41 53 37 47 41 37 29 20 26 43 38 33 37 37 35 33 36 41 25 37...
The accompanying table provides data for the sex, age, and weight of bears. For sex, let...
 The accompanying table provides data for the sex, age, and weight of bears. For sex, let 0 represent female and let 1 represent male. Letting the response (y) varieble represent weight, use the dummy variable of sex and the variable of age and to find the multiple regression equation, Use the equation to find the predicted weight of a bear with the characteristics given below. Does sex appear to have much of an effect on the weight of a bear?...
Please answer this like right now West Battery Corp. has recently been receiving complaints from retailers...
 Please answer this like right now
West Battery Corp. has recently been receiving complaints from retailers that its 9-volt batteries are not lasting as long as other name brands. James West, head of the TQM program at West's Austin plant, believes there is no problem because his batteries have had an average life of 40 hours, about 10% longer than competitors' models. To raise the lifetime above this level would require a new level of technology not available to West....
Please answer this like right now
West Battery Corp. has recently been receiving complaints from retailers that its 9-volt batteries are not lasting as long as other name brands. James West, head of the TQM program at West's Austin plant, believes there is no problem because his batteries have had an average life of 40 hours, about 10% longer than competitors' models. To raise the lifetime above this level would require a new level of technology not available to West....
1/ 1 machine malfunction. What is occurring? y of underfilling the bottles by 34./Using the data...
 1/ 1 machine malfunction. What is occurring? y of underfilling the bottles by 34./Using the data in the Excel file Consumer Transportation Survey, develop a contingency table for Gender and Vehicle Driven then convert this table to a joint proba- bility distribution and compute marginal probabilities a. What is the probability that a respondent is male b. What is the probability that a female respondent c. If it is known that an individual drives a car, what is d. If...
Pls help on filling out Tritraion of a Polyprotic acid chart Data from lab Titration #1...
 Pls help on filling out Tritraion of a Polyprotic acid chart
Data from lab
Titration #1
Titration #2
Titration #3
mL base added
pH
mL base added
pH
mL base added
pH
1
0.7
1
0.7
1
0.7
2
1.1
2
1
2
0.9
3
1.5
3
1.4
3
1.3
4
1.7
4
1.6
4
1.5
5
1.9
5
1.8
5
1.7
6
2
6
2.1
6
2
7
2.2
7
2.2
7
2.2
8
2.4
8
2.3
8
2.2...
Pls help on filling out Tritraion of a Polyprotic acid chart
Data from lab
Titration #1
Titration #2
Titration #3
mL base added
pH
mL base added
pH
mL base added
pH
1
0.7
1
0.7
1
0.7
2
1.1
2
1
2
0.9
3
1.5
3
1.4
3
1.3
4
1.7
4
1.6
4
1.5
5
1.9
5
1.8
5
1.7
6
2
6
2.1
6
2
7
2.2
7
2.2
7
2.2
8
2.4
8
2.3
8
2.2...
Data were collected on the amount spent by 64 customers for lunch at a major Houston...
 Data were collected on the amount spent by 64 customers for lunch at a major Houston restaurant. These data are contained in the file named Houston. Based upon past studies the population standard deviation is known with = $8. Click on the datafile logo to reference the data. DATA file Round your answers to two decimal places. If needed, use the critical value with three decimal places. a. At 99% confidence, what is the margin of error? b. Develop a...
Using the Patient Hospital data provided, generate a control chart for the patient’s arterial pre...
 Using the Patient Hospital data provided, generate a control chart
for the patient’s arterial pressure. Please ensure it is
appropriately lats) 14. What is your interpretation of control
chart? Are there any instances where a special cause variation
occurred?
Measureme mean artieral pressure 1 101.1987 2 60.48758 3 79.49941 4 101.8304 5 67.84826 6 106.526 7 92.37818 8 64.232 9 64.24642 10 66.8727 11 61.85136 68.55 13 63.223 14 80.14746 15 80.83528 16 97.42948 17 73.93494 48.86 19 83.31279 20...
Using the Patient Hospital data provided, generate a control chart
for the patient’s arterial pressure. Please ensure it is
appropriately lats) 14. What is your interpretation of control
chart? Are there any instances where a special cause variation
occurred?
Measureme mean artieral pressure 1 101.1987 2 60.48758 3 79.49941 4 101.8304 5 67.84826 6 106.526 7 92.37818 8 64.232 9 64.24642 10 66.8727 11 61.85136 68.55 13 63.223 14 80.14746 15 80.83528 16 97.42948 17 73.93494 48.86 19 83.31279 20...
The subjects in the data are college students. In the data, id is student ID, anxiety...
The subjects in the data are college students. In the data, id is student ID, anxiety is student’s anxiety score via Anxiety Scale, selfest is student’s self-esteem score via Rosenberg Self-esteem Scale, GPA is student’s GPA; for gender, 0=female, 1=male; for grade, 1=freshman, 2=junior, 3=senior. We have known that population mean for Anxiety Scale is μ=60 with σ=10. Raise relevant questions ( 2 questions is fine) about the data extensively, the questions can be either about descriptive analysis or inferential...
2. The following data were collected last semester on ten students. Complete a multiple regression analysis in which you use AGE (A), MATH PROFICIENCY (MP) (on a 1 –10 scale), and GENDER (G) (0 = male...
2. The following data were collected last semester on ten students. Complete a multiple regression analysis in which you use AGE (A), MATH PROFICIENCY (MP) (on a 1 –10 scale), and GENDER (G) (0 = male, 1 = female) as predictors of FINAL EXAM (FE) performance. Do this analysis in SPSS and then answer the following questions. Subject # A MP G FE 1 35 8 1 90 2 31 6 0 88 3 26 5 1 84 4 33...
You have done a market research study for a local restaurant by surveying 50 customers. You...
You have done a market research study for a local restaurant by surveying 50 customers. You asked several Likert-type scaled questions, requesting level of agreement with a series of statements (where 1 = completely disagree and 7 = completely agree). These questions include: X1: I liked the food at the restaurant. (respond on a 1-7 scale) X2: I liked the service at the restaurant. (respond on a 1-7 scale). Your results are in the Excel spreadsheet “Customer Satisfaction Study Part...
 Sample Data Sample Data Hour Sample Taken Hour Sample Taken 1 4 5 X 1 3 1 42 2 3 4 5 6 2 39 36 25 60 28 53 22 56 41 34 43 45 59 42 36 40 45 39 48 26 42 34 61 48 45 29 3 31 61 38 40 54 26 38 42 37 41 53 37 47 41 37 29 20 26 43 38 33 37 37 35 33 36 41 25 37...
 The accompanying table provides data for the sex, age, and weight of bears. For sex, let 0 represent female and let 1 represent male. Letting the response (y) varieble represent weight, use the dummy variable of sex and the variable of age and to find the multiple regression equation, Use the equation to find the predicted weight of a bear with the characteristics given below. Does sex appear to have much of an effect on the weight of a bear?...
 Please answer this like right now
West Battery Corp. has recently been receiving complaints from retailers that its 9-volt batteries are not lasting as long as other name brands. James West, head of the TQM program at West's Austin plant, believes there is no problem because his batteries have had an average life of 40 hours, about 10% longer than competitors' models. To raise the lifetime above this level would require a new level of technology not available to West....
Please answer this like right now
West Battery Corp. has recently been receiving complaints from retailers that its 9-volt batteries are not lasting as long as other name brands. James West, head of the TQM program at West's Austin plant, believes there is no problem because his batteries have had an average life of 40 hours, about 10% longer than competitors' models. To raise the lifetime above this level would require a new level of technology not available to West....
 1/ 1 machine malfunction. What is occurring? y of underfilling the bottles by 34./Using the data in the Excel file Consumer Transportation Survey, develop a contingency table for Gender and Vehicle Driven then convert this table to a joint proba- bility distribution and compute marginal probabilities a. What is the probability that a respondent is male b. What is the probability that a female respondent c. If it is known that an individual drives a car, what is d. If...
 Pls help on filling out Tritraion of a Polyprotic acid chart
Data from lab
Titration #1
Titration #2
Titration #3
mL base added
pH
mL base added
pH
mL base added
pH
1
0.7
1
0.7
1
0.7
2
1.1
2
1
2
0.9
3
1.5
3
1.4
3
1.3
4
1.7
4
1.6
4
1.5
5
1.9
5
1.8
5
1.7
6
2
6
2.1
6
2
7
2.2
7
2.2
7
2.2
8
2.4
8
2.3
8
2.2...
Pls help on filling out Tritraion of a Polyprotic acid chart
Data from lab
Titration #1
Titration #2
Titration #3
mL base added
pH
mL base added
pH
mL base added
pH
1
0.7
1
0.7
1
0.7
2
1.1
2
1
2
0.9
3
1.5
3
1.4
3
1.3
4
1.7
4
1.6
4
1.5
5
1.9
5
1.8
5
1.7
6
2
6
2.1
6
2
7
2.2
7
2.2
7
2.2
8
2.4
8
2.3
8
2.2...
 Data were collected on the amount spent by 64 customers for lunch at a major Houston restaurant. These data are contained in the file named Houston. Based upon past studies the population standard deviation is known with = $8. Click on the datafile logo to reference the data. DATA file Round your answers to two decimal places. If needed, use the critical value with three decimal places. a. At 99% confidence, what is the margin of error? b. Develop a...
 Using the Patient Hospital data provided, generate a control chart
for the patient’s arterial pressure. Please ensure it is
appropriately lats) 14. What is your interpretation of control
chart? Are there any instances where a special cause variation
occurred?
Measureme mean artieral pressure 1 101.1987 2 60.48758 3 79.49941 4 101.8304 5 67.84826 6 106.526 7 92.37818 8 64.232 9 64.24642 10 66.8727 11 61.85136 68.55 13 63.223 14 80.14746 15 80.83528 16 97.42948 17 73.93494 48.86 19 83.31279 20...
Using the Patient Hospital data provided, generate a control chart
for the patient’s arterial pressure. Please ensure it is
appropriately lats) 14. What is your interpretation of control
chart? Are there any instances where a special cause variation
occurred?
Measureme mean artieral pressure 1 101.1987 2 60.48758 3 79.49941 4 101.8304 5 67.84826 6 106.526 7 92.37818 8 64.232 9 64.24642 10 66.8727 11 61.85136 68.55 13 63.223 14 80.14746 15 80.83528 16 97.42948 17 73.93494 48.86 19 83.31279 20...
Most questions answered within 3 hours.
-
For the following reaction, 0.128 moles of
potassium hydrogen sulfateare mixed with
0.504 moles of potassium...
asked 2 hours ago -
1. What is the present value of $400, three years in the future
if the interest...
asked 3 hours ago -
The labor force minus the number of employed equals the number
of unemployed.
a. True
b....
asked 5 hours ago -
Determine the mass in units of grams [g] of 0.49 moles [mol]
of a new fictitious...
asked 5 hours ago -
A horizontal mass of M=5kg is on a spring and stretched to
x=0.5m when released from...
asked 6 hours ago -
26 of 50
"I have worked at the Arizona Humane Society for ten years, and
have...
asked 7 hours ago -
Compare and contrast zero based budgeting and incremental (or
base year) budgeting.
asked 7 hours ago -
4 pts 10. Which of the following hypothesis would be MOST
difficult to test experimentally? Group...
asked 7 hours ago -
A business owner makes 1,000 items a day. Each day he or she
contributes eight hours...
asked 7 hours ago -
A
circular loop in the plane of a paper lies inca0.65 T magnetic
field pointing into...
asked 7 hours ago -
A business owner is trying to decide whether to buy, rent, or
lease office space and...
asked 7 hours ago -
Thermal Storage Solar heating of a house is much more efficient
if there is a way...
asked 7 hours ago