python find the maximum amount of rainfall on days where the maximum temperature was above 35...
python
find the maximum amount of rainfall on days where the maximum temperature was above 35 degrees Celsius. This time, should incoporate pandas in program. Provided dataset is a file called climate_data_2017.csv. The maximum temperature record is in the third column (index 2) and the rainfall is in the fourth column (index 3).
Result: Maximum amount of rainfall on hot days: 3.8 mm
data file:
Date,Minimum temperature (C),Maximum temperature (C),Rainfall
(mm),Evaporation (mm),Sunshine (hours),Direction of maximum wind
gust,Speed of maximum wind gust (km/h),9am Temperature (C),9am
relative humidity (%),3pm Temperature (C),3pm relative humidity
(%
2017-01-13,23,30.5,0,8.6,8.9,SSW,52,24.6,68,29,57
2017-01-14,24.6,32.5,0,10.6,7.1,ESE,35,28.7,59,29.2,52
2017-01-15,22.8,27,0,8,6.9,ESE,33,25.6,56,25.5,57
2017-01-16,21.7,27.2,0,7.2,12.1,NE,52,26.2,55,26.3,57
2017-01-17,20.8,36.6,0,10.4,11.9,NNE,50,25.3,64,32.6,44
2017-01-18,25.1,38.1,0,13.8,11.1,SSE,59,36.5,26,30.1,52
2017-01-19,20.1,24.5,0,12.6,0,ENE,41,21.5,61,22.7,53
2017-01-20,19,29.2,0,5.8,2.6,SSW,65,24.1,62,28.3,68
2017-01-21,20.8,27.4,7.8,6.2,9.7,SSE,48,22.2,49,26.6,42
2017-01-22,20.4,26.5,0,9.1,10.7,ENE,39,23.8,50,26,50
2017-01-23,21.5,32.6,0,9.6,12.1,NE,56,25.5,60,28.6,51
2017-01-24,24.5,37,0,12,2.6,SSW,69,32.6,34,35,33
2017-01-29,22.3,30.2,0,11.4,6.8,S,31,24.5,74,28.9,56
2017-01-30,23.1,34.3,0,6,12,NNE,56,27.9,67,30.3,54
2017-02-05,25.8,34.9,0,9.6,7,NW,41,29.5,50,34.1,41
2017-02-06,26.2,34.7,0,11.8,10.9,S,48,29.6,55,33.9,44
2017-02-07,22.1,24.9,6.4,8.2,1.3,,,22.2,88,21,89
2017-02-12,24.5,31.9,0,10.4,7.8,SSE,59,28.1,67,28.1,59
2017-02-13,17.8,27.3,0,7,12.8,SW,37,21.9,29,26.9,32
2017-02-14,21.6,24,0,9,1.9,SSE,44,22.3,68,21.2,73
2017-02-15,18,26.1,25.6,1.2,10.1,ENE,37,21.3,66,26.1,52
2017-02-16,19.5,30,0,8,11.1,NNE,54,23.4,63,28.8,51
2017-02-17,22.6,29.9,0,11.2,6.6,N,70,26.6,66,26.8,59
2017-02-18,21.8,29.4,8,5.4,7,SE,41,22.9,79,28.8,58
2017-02-19,18.6,26.1,3.2,6.4,7.9,S,48,19.7,69,25,48
2017-02-20,17.5,28.3,0.6,8,12.5,WSW,63,19.9,32,27.5,18
2017-02-21,16.9,27.6,0,10.4,11.7,NNE,33,19.4,41,26.3,36
2017-02-22,19.3,27.7,0,7,12.2,NE,48,25.8,50,26.2,47
2017-02-23,21.6,28.1,0,11.6,11.5,NNE,46,25.4,55,27.3,52
2017-02-24,21.8,28,0,10.6,5.7,S,31,24.5,69,27.3,56
2017-02-25,18.6,20.8,7.8,4.4,0,SSW,44,18.7,89,19,87
2017-02-26,18.3,25.5,28.6,5.8,5.3,S,48,20.7,67,24.3,54
2017-02-27,18.7,26.6,26.4,7.6,7.5,ESE,44,23.3,60,25.6,47
2017-02-28,20.7,26.7,2.6,5.6,9.2,ESE,48,25.1,63,26.4,61
2017-03-01,20.6,27.2,26.4,7.2,2.2,E,43,21.4,87,25,67
2017-03-02,20.5,26.3,3.2,3.6,7.6,E,26,23,81,25,69
2017-03-03,20.7,24.8,37.8,5.2,1.4,SE,63,21.7,89,22.2,85
2017-03-04,19.9,23.3,27.6,4,0.2,SSE,54,21.5,87,20.9,86
2017-03-05,20.1,23,7.6,2.4,0,SW,56,20.4,78,22.1,76
2017-03-06,19.6,25.7,2.4,4,7.7,SSW,65,20.5,63,25.5,49
2017-03-07,18.8,23.2,0,9.4,3.6,SSE,54,19.3,73,21.7,62
2017-03-08,16.9,23.5,5,8.8,1.4,SE,46,19.9,67,22,56
2017-03-09,17.9,25.1,1,5.4,2.7,SSE,43,20.3,69,23.3,54
2017-03-10,17.3,25.8,0.6,5.4,7.4,SSE,44,19.3,73,25.1,51
2017-03-11,16.9,26.1,0.2,5,10.7,SSE,31,20.1,61,25.5,47
2017-03-12,17.4,26.4,0,7.2,10.6,NNE,46,22.3,62,26,50
2017-03-13,22.2,27.4,0,7.2,6.2,E,56,23.7,68,27,63
2017-03-14,22.6,25.9,0.4,7.6,0.5,E,44,23.9,71,21.4,67
2017-03-15,19.8,25.9,38,,5.5,E,54,22.9,76,24.8,67
2017-03-16,21.9,24.9,2.6,7.6,1,ENE,56,23.1,84,24.5,85
2017-03-17,20,22.7,20,3,1.3,S,59,20.3,83,20.5,81
2017-03-18,19.3,25.8,45.8,2.8,3.6,SSE,65,21.8,88,24.1,79
2017-03-19,21.6,26.2,4.2,,5.5,ESE,57,23.7,86,25.3,76
2017-03-20,23.7,27.9,0.2,8.4,4.4,NNE,39,25.8,74,26.9,66
2017-03-21,23.3,27.1,0,5.2,1.5,NNE,30,24.5,77,26,72
2017-03-22,22.3,31.9,25.6,6,4.4,WSW,63,23.9,82,29.8,57
2017-03-29,21.4,28.8,0,2.4,8.4,E,30,22.5,84,27,71
2017-03-30,22.5,26,2.4,7.4,0,SSW,69,25.2,70,19.2,88
2017-03-31,15.3,22.6,42.4,,9.9,SW,54,16.9,56,21.6,53
2017-04-01,14.5,25.6,0,,10.7,SSE,35,17.1,63,22.5,48
2017-04-02,17,22,0,,5.8,SSE,50,19.8,66,20.1,59
2017-04-03,14.8,22,33.8,4.2,1.5,SSE,50,15.7,90,21.8,49
2017-04-04,14.9,22.8,7.8,0.4,6.4,SE,41,17.9,78,20.7,60
2017-04-05,14.1,23.3,0.4,5.4,10.2,ESE,37,18.1,72,22.9,45
2017-04-06,13.2,23.4,0.2,6,8.7,ESE,24,17.1,69,23.2,42
2017-04-07,14.1,23.8,0,3.4,10.6,ENE,28,18.7,69,23.7,41
2017-04-08,14.9,24.9,0,5,9.8,ENE,37,18.4,68,23.1,49
2017-04-09,15.5,28.7,0,7,9.6,WNW,67,20.1,62,27.9,35
2017-04-10,11.7,17.9,8.8,7.8,6.1,W,54,13.9,51,15.7,56
2017-04-11,13.8,23,0,3.6,2.1,SSW,54,17.9,56,22.2,48
2017-04-21,14.4,23.9,0,4,7.2,ENE,26,17.9,68,22.4,58
2017-04-22,17.7,24.1,0,4.2,3.5,N,19,19.9,68,22.5,60
2017-04-23,15.9,26.7,0,3.6,9.5,E,22,18.5,74,23.6,58
2017-04-24,15.7,23.9,0,3,10,NNE,24,18.2,74,22.7,61
2017-04-25,18.2,26.7,0,4.4,3,NW,39,20.6,69,21.9,65
2017-04-26,16.9,24.8,1.8,4.6,7.9,WSW,67,20.2,55,18.1,43
2017-04-27,12.1,20,0.4,7,8.2,S,46,13.1,46,18.5,45
2017-04-28,10.2,21.8,0,5,10.4,SW,44,13.5,51,20.1,39
2017-04-29,10.8,22.7,0,3.6,10.5,W,31,14,60,21.2,51
2017-04-30,14,22.6,0,3,7.8,SSE,28,17.2,66,20.5,59
2017-05-01,13.2,25.6,0,4,9.5,NNW,30,15.9,78,24.2,40
2017-05-02,14.6,23.9,0,5,8.4,SSW,39,17.2,65,23.2,33
2017-05-03,14.9,18.4,1.4,5,3.4,S,43,16.9,61,16.3,67
2017-05-04,11.8,20,3.8,3.8,3.3,W,24,14.7,78,19.5,45
2017-05-05,12.7,21.6,0.4,2.4,8.5,E,26,15.1,74,20.5,54
2017-05-06,12.7,26.2,0,4,8.4,NNW,43,14.8,77,25.2,39
2017-05-07,14.6,22.2,0.2,4,10,W,50,17.2,47,21.1,25
2017-05-08,10.2,20.1,0,,9.9,SSW,33,12.2,49,18.9,41
2017-05-09,10.7,21,0,9.6,7.5,SSE,31,13.3,67,19.8,45
2017-05-10,10.5,21.7,0,3.4,10,W,37,13.3,70,20.3,52
2017-05-11,10.9,22.1,0,2,8.5,W,30,13.4,73,19.7,56
2017-05-12,12.5,19.6,0.4,2.6,1.7,WNW,26,14.1,78,18.5,71
2017-05-13,14,21.3,3.2,0.6,7.3,ENE,28,15.8,86,20.1,67
2017-05-14,14.7,18.7,0,4,0.3,ESE,26,16.3,89,18.1,74
2017-05-15,13.1,20.8,5.2,1.6,5.5,SSW,43,14.6,75,20.2,49
2017-05-16,11.1,21.9,0,3,9.9,W,33,14.4,59,20.3,39
2017-05-17,9.8,20.2,0,3.4,9.5,W,28,12.7,72,19.6,52
2017-05-18,12.6,21.5,0,3.6,6.4,E,33,14.8,79,20.2,62
2017-05-19,14.8,20.4,0,1.4,0.5,NNE,43,19.5,78,20.2,72
2017-05-20,16.7,23.2,14.6,1,5.4,NE,35,17.5,86,22.8,58
2017-05-21,13.8,23.5,0,4,9.2,W,30,15.7,69,21.9,49
2017-05-22,13,21,0,1,6.9,W,22,14.7,84,20.1,65
2017-05-23,14.7,22.6,0,2.4,8.8,ENE,24,16.6,82,22.4,65
2017-05-24,14.8,22.7,0.8,3.4,9,WSW,54,16.7,77,22.5,31
2017-05-25,11.6,21.4,0,5.6,9.6,WSW,33,14,60,19.7,43
2017-05-26,10.6,20.8,0,1.8,9.8,W,30,14,58,19.6,56
2017-05-27,12.6,20.6,0,2.8,7,W,24,14.2,77,19.4,65
2017-05-28,11.9,23.7,0,2.4,8.4,NNW,48,13.3,83,23.2,37
2017-07-19,10.6,17.5,0,6.6,9.1,WSW,57,12,53,16.9,33
2017-07-20,9.3,17.5,0,4.4,9.6,WSW,63,11.4,55,15.8,26
2017-07-21,7.5,18,0,4.2,9.2,W,46,9.6,53,17.4,37
2017-07-22,6,19.1,0,3.6,9.8,W,31,7.9,64,18.7,27
2017-07-23,6.5,22.1,0,3.6,9.9,NW,44,10.8,49,22.1,22
2017-07-24,10,21.3,0,7.2,9.6,WSW,31,12.7,51,20.9,24
2017-07-25,7.9,20.6,0,4.2,9.9,NW,30,11,63,19.7,32
2017-07-26,11,21.3,0,2.8,9.9,W,70,18,39,20.2,27
2017-07-27,9.1,17.5,0,4.8,9.7,W,31,11.2,61,17.1,44
2017-07-28,11.2,19.1,0,4.2,8.3,WSW,67,13.1,51,18.9,25
2017-07-29,8.2,21.2,0,4.6,9.9,W,31,10.7,52,20.9,23
2017-07-30,10.7,26.5,0,6,6.2,NNW,44,18.4,25,24.8,22
2017-07-31,15.6,16.5,0,4.4,0,WSW,56,15.7,72,11.8,85
2017-08-01,8.6,18.1,6,2.4,9.8,SW,39,11.6,57,16.9,39
2017-08-02,7.2,18.2,0,3.2,8.8,S,41,9.6,62,16.8,51
2017-08-03,8.9,17.4,3,2.8,5.5,NNE,37,10.3,85,16.4,70
2017-08-04,10.3,17.3,13.8,1.8,10.2,W,50,12.8,60,16.6,41
2017-08-05,9.6,19.9,0,5.6,10.1,WNW,48,14,46,19.3,22
2017-08-06,12.1,21.3,0,6.8,9.9,NW,54,15,46,20.9,26
2017-08-07,13.5,18.4,0,6.8,9.8,W,63,14.7,44,16.9,25
2017-08-08,9.7,19.3,0,7.2,10.3,WSW,54,12.1,45,18.5,24
2017-08-09,9.2,20.9,0,5,10.4,W,33,12,53,20,32
2017-08-10,9.2,24.2,0,4,9.4,NNW,31,11.8,64,23.5,24
2017-08-11,11.8,25.9,0,7.6,7.9,WSW,37,20.7,24,25.2,23
2017-08-12,9.6,21.4,0,6.2,6.9,WSW,44,13.5,43,20.7,27
2017-08-13,10.2,20.6,0,3.2,10.1,WSW,33,13.2,54,18.5,43
2017-08-14,8.5,23.1,0,3.8,10,W,24,10.9,71,23,24
2017-08-15,10.7,22.4,0,4.8,3,W,35,12.8,57,20.1,44
2017-08-16,12.8,21.8,0,6,9.6,W,74,20.5,42,20.5,28
2017-08-17,11.3,22.4,0,7.2,10.5,WNW,54,15.7,42,22,20
2017-08-18,11.4,16.9,0,8.4,10.6,W,93,13.6,41,16,28
2017-08-19,8.7,16.5,0,6.4,10.4,S,63,11.1,41,16.2,33
2017-08-20,6.4,16.2,0.2,5.4,9.1,W,41,9.8,44,15,53
2017-08-21,8.3,17.7,0,3.4,2,W,30,11.7,66,15.9,48
2017-08-22,8.7,20.2,0,1.4,10.6,W,22,11.8,61,18.2,37
2017-08-23,8.3,19.9,0,3.8,10.6,NNE,31,12.1,64,18.6,60
2017-08-24,11.2,18,0,4,7.8,SSW,54,13.6,46,17.1,49
2017-08-25,9.6,17.9,0,5.2,9.4,SSW,48,12.7,55,16.5,51
2017-08-26,7.7,20.4,0,3.8,10.3,W,30,11.1,66,17.3,44
2017-08-27,8.6,19.5,0,4,8.4,SSW,57,12.8,44,19.3,27
2017-08-28,7.6,16.3,1.2,5.4,7.6,SW,59,10.9,54,15.3,43
2017-08-29,7.5,16.7,0,4,7,W,30,10.6,62,16,46
2017-08-30,8.4,19,0,3.8,10.6,SSW,48,11.9,44,17.7,35
2017-08-31,7.8,17.7,0,5.6,7.7,SSE,56,11.7,43,14.6,52
2017-09-01,8.2,19.2,0,3.4,9.8,W,33,12.2,52,17.7,44
2017-09-02,7.8,19.4,0,4.8,10.8,W,24,11.8,69,17.5,49
2017-09-03,10,27.2,0,5,7.3,NW,48,15.3,55,26.6,16
2017-09-04,12,22.2,0,7.6,10.7,WNW,56,16,35,21.7,22
2017-09-05,11.4,18.7,0,10.4,10.8,W,61,14.7,31,18.2,22
2017-09-06,11.5,19.9,0,8,10.6,WNW,59,14.6,31,19,21
2017-09-07,10,21.9,0,7,10.6,W,50,15.7,38,21.5,21
2017-09-08,11.1,20.4,0,5.6,10.8,W,65,16,39,19.9,22
2017-09-09,9.6,19.4,0,8,10.8,WSW,44,13.1,37,17.7,31
2017-09-10,8,19.1,0,5,10.8,W,24,13.5,52,17.3,51
2017-09-11,8.7,22.7,0,3.8,10.1,NE,24,14.4,60,22.5,29
2017-09-12,11.3,27.2,0,5.8,2.3,E,26,18.2,43,23.4,34
2017-09-13,18.2,33.8,0,6.2,9.6,NNW,70,24.9,19,32.5,10
2017-09-14,12,17.3,0.2,13,10.5,WSW,72,13.8,37,16.4,26
2017-09-15,10.5,22.8,0,7.8,10.6,W,52,16.6,37,22.2,24
2017-09-16,12.5,24.2,0,7,6.4,SSW,56,17.3,43,21.3,22
2017-09-17,8.1,18.6,0,4.6,10.8,ESE,28,13.6,48,16.4,37
2017-09-18,8.2,21,0,5.6,10.7,NE,39,14,55,20.2,55
2017-09-19,14,25.2,0,6.4,10.8,SSW,54,20.4,30,23.1,16
2017-09-20,10.7,19,0,9.2,7.7,WSW,33,14.6,44,17.7,56
2017-09-21,10.4,21.3,0,3.8,10.1,NE,30,15.6,65,21.2,49
2017-09-22,12.8,27.7,0,7.2,10.5,NNE,35,20.1,35,25.8,26
2017-09-23,15.5,32.2,0,8.6,5.7,NNE,50,23,25,29.1,25
2017-09-24,23,29.2,0,12,6.5,W,54,27.1,20,27.8,15
2017-09-25,16,26.7,0,10.8,10.8,WNW,57,22.3,21,23.3,19
2017-09-26,12.3,22.2,0,9.6,11,WSW,41,19.5,29,19,47
2017-09-27,15.4,22.7,0,6.6,8.2,ENE,50,18.1,58,21.1,62
2017-09-28,18,25.7,0,6.2,3.8,WNW,59,22.7,47,24.1,26
2017-09-29,13,26.9,0,6.8,11.1,W,39,20.4,36,26.8,20
2017-09-30,16.3,24.1,0,9.2,0.7,WSW,59,18.8,30,23.5,15
2017-10-01,11.2,23.1,0,6,10.6,W,31,15.4,65,19.3,36
2017-10-02,12,22.9,0,6.2,10.1,NE,44,16.7,55,21.3,60
2017-10-03,16.7,22.1,0,7,5.4,NNE,39,18.9,69,20.1,65
2017-10-04,15.6,23.8,0,3.6,8.7,SE,30,20.4,72,22.1,58
2017-10-05,16.5,23.4,0,5,9.6,NNE,41,19.5,73,22.6,64
2017-10-06,18,22.1,0,6.6,4.7,SSW,39,18.9,66,20.3,46
2017-10-07,13.7,22,0,6.2,8.7,SSW,43,16.2,52,21.1,46
2017-10-08,13,21.4,0,4.8,2.3,ENE,31,16.6,70,19.6,64
2017-10-09,16.6,30,0,2.6,8.3,S,48,20.1,74,27.5,45
2017-10-10,16.1,21.3,0,8,4.7,ENE,39,19,62,20.5,59
2017-10-11,18,23.2,0,5.6,3.8,NNE,48,19.3,86,22.6,75
2017-10-12,19.2,29.6,0,3.6,9.6,SW,46,23.2,61,27.3,30
2017-10-13,14.7,23.2,0,7.2,10.5,NE,46,18.4,69,22.7,55
2017-10-14,17.1,22.3,0,7.6,0,S,54,18.7,63,18.2,61
2017-10-15,16,22.4,0,3.8,2.4,ESE,28,22.3,52,20.1,58
2017-10-16,15.9,23.3,0,5,10.4,E,30,22.4,55,22.3,50
2017-10-17,16.9,23.5,0,7.6,9.9,ENE,39,21.2,57,22.9,47
2017-10-18,18.8,23.2,0,9,10.4,NNE,50,20.9,64,22.5,56
2017-10-19,17.1,25.3,0,10,11.4,NNE,52,22.1,52,24.6,47
2017-10-20,19,19.6,7.8,9.2,0,S,56,19.6,87,15.3,85
2017-10-21,13,20,16.4,4.4,11.3,SSW,50,16.8,52,18.9,53
2017-10-22,13.4,21.7,0.2,4.8,5.5,ESE,30,16,75,18.7,60
2017-10-23,12.7,23,3.4,3.6,12.1,S,31,18,60,22.1,43
2017-10-24,13.9,24.3,0,6.8,10.5,NE,39,19.9,57,22.6,55
2017-10-25,18,26.9,0,8,5,S,59,21,67,23.3,56
2017-10-26,17.2,24.6,0.4,7,6.5,WSW,63,19.7,73,22.6,63
2017-10-27,14.8,24.2,34.2,7.2,3.9,WSW,61,18.1,85,22.3,65
2017-10-28,17.5,25.1,0.2,3.2,7.7,ENE,35,21.6,66,22.3,65
2017-10-29,20.2,29.6,0.2,4.6,10.6,NNE,39,24.4,49,27.7,35
2017-10-30,20.3,35.4,0,11.4,9.3,SSW,69,28.5,37,34.9,13
2017-10-31,13,20.5,0,12,10.1,SSE,57,15.8,43,19.7,36
2017-11-01,13,22.2,0,9.6,4.2,SSW,54,15.4,39,21,32
2017-11-02,15.3,22.6,0,5.6,9.9,ESE,31,20.1,56,21.8,46
2017-11-03,16.9,26.9,0,6.6,5.9,SSW,57,20.6,58,25.7,48
2017-11-04,16.2,17.1,1.6,7.4,0,SSE,39,17,73,15.8,78
2017-11-05,14.1,19.5,31.8,2.6,0,ENE,39,14.9,85,17.7,59
2017-11-06,14.8,26.3,4.4,1.8,5.7,SSW,67,19.4,81,23.6,57
2017-11-24,18.2,25.9,0,10.8,9.3,NE,41,23.4,59,24.5,54
2017-11-25,18.9,26.4,0,8,12.6,ENE,35,23.8,59,24.3,62
2017-11-26,19.3,26.8,0,8.4,10.1,NE,48,24.4,65,24.8,64
2017-11-27,20.6,25.1,0,8.6,1.9,ENE,39,23.7,66,24.5,65
2017-11-28,19.3,27.7,0,5.8,11.1,SE,35,25.1,64,26.9,59
2017-11-29,20.6,26.4,0.8,,7.7,E,26,22.8,78,25.8,64
2017-11-30,20.2,26.7,1.8,10.8,10.9,ENE,48,24.4,66,25.9,62
2017-12-01,20.1,27.5,0.2,8.6,11.3,NE,59,25.4,62,26.6,57
2017-12-02,19.7,26.8,0,11,1.3,WNW,72,22.9,72,24.6,62
2017-12-03,16.9,29.2,10.8,0.6,13.5,E,37,22.1,45,23.7,50
2017-12-04,16.1,18.6,3,10,0.4,SSW,52,16.8,79,17.1,81
2017-12-05,16,25.3,7.6,0.6,5.9,SSW,63,18.4,71,23.8,54
2017-12-06,18.2,26,0.2,10.2,5.7,SW,44,19.8,59,19.3,68
2017-12-07,17.5,31.3,5.8,6.4,12.6,NE,43,25.2,39,28.3,32
2017-12-08,21.4,27.7,0,12.8,8.9,SE,50,22.8,44,23.7,52
2017-12-09,18.1,24.1,0,8,7.9,SSE,35,21.4,52,22.6,46
2017-12-10,17.3,24.8,0,7.4,12.7,ENE,39,23,54,24.2,50
2017-12-11,18,26.5,0,10.4,13.1,ENE,43,24,49,25.8,47
2017-12-12,20.3,27,0,10.2,12.2,ENE,41,25.2,56,25.2,57
2017-12-13,19.3,28,0,10,13,NNE,56,24.7,59,28,52
2017-12-14,20.9,30.8,0,9.2,11.6,NNE,59,27.3,54,29.9,43
2017-12-15,20.7,26.6,0.2,13.4,0.1,SSW,54,21.9,73,26.3,61
2017-12-16,21.4,28.5,1.4,2.6,11.6,NE,48,25.3,67,25.9,61
2017-12-17,21.9,26.8,0.6,10,1.1,SE,39,23.1,82,24.5,71
2017-12-18,21.1,27.6,0.2,3.2,5.8,ENE,33,24.8,69,25.6,64
2017-12-19,22.3,35.3,0,6.4,5.2,NNE,57,25.4,69,30.1,50
2017-12-20,25.2,38.3,0,11.4,8.6,SSW,78,35.3,32,27.1,60
2017-12-21,21.2,24.5,3,,1.1,ESE,39,23.7,62,22.9,64
2017-12-22,21.2,26.1,0.2,13.6,7.9,ENE,35,23.9,63,25,59
2017-12-23,20.1,28.3,0,7.6,12.3,NE,41,24.8,61,26.7,56
2017-12-24,21,37.7,0,10,7.6,SSE,50,28.3,53,28.4,52
2017-12-25,18.5,21.7,1.2,10,0.2,SSE,46,20,64,21,62
2017-12-26,19.5,23.8,0,5.2,0,ENE,43,21.3,54,22.6,54
2017-12-27,18.8,26.2,3,4.6,10.9,E,43,23.7,60,24.9,62
2017-12-28,19.2,27.4,0,9.8,10.8,ENE,44,25,59,26.2,57
2017-12-29,21.3,28.8,0,8.2,8.4,NE,33,25.6,72,28.3,58
2017-12-30,22.4,36.2,3.8,8.4,8,WNW,44,23.6,82,34.8,27
2017-12-31,20.1,25.3,6,9.2,7.1,,,21.1,76,24.6,61
Homework Answers
Code:
import pandas as pd #importing pandas pacakage
data=pd.read_csv("climate_data_2017.csv") #reading climate_Data csv file using pandas
df1=data.loc[data['Maximum temperature (C)']>35.00] #filtering the data where the maximum temparature is >35
print ('Maximum amount of rainfall on hot days: ' + str(df1['Rainfall (mm)'].max()))
#after that finding the maximum rain fall value among that filtered data
Code and Output Screenshots:

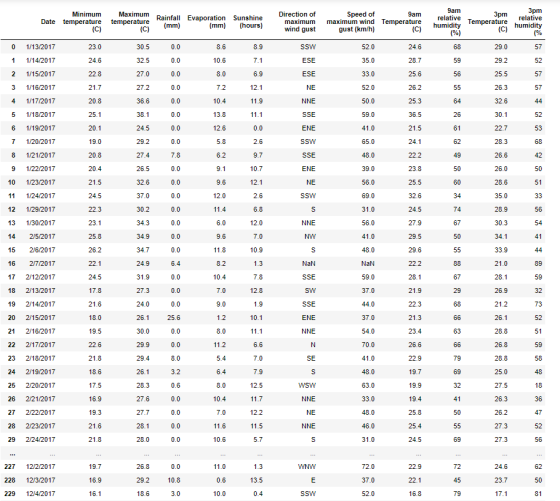
csv file screenshot for reference:

Add Answer to:
python
find the maximum amount of rainfall on days where the maximum
temperature was above 35...
Need help writing a program that meets pseudocode and criteria . Txt File below input.txt file...
 Need help writing a program that meets pseudocode and criteria .
Txt File below
input.txt file data
05 11/30/16
03 12/07/16
05 12/07/16
05 12/08/16
01 12/10/16
07 12/11/16
07 12/14/16
06 12/15/16
02 12/21/16
05 12/21/16
06 12/22/16
07 12/22/16
08 12/23/16
07 12/23/16
07 12/23/16
07 12/23/16
08 12/24/16
08 12/24/16
07 12/24/16
03 12/26/16
05 12/26/16
07 12/28/16
04 12/29/16
07 01/01/17
06 01/03/17
07 01/03/17
08 01/05/17
05 01/10/17
04 01/17/17
08 01/17/17
07 01/18/17
07...
Need help writing a program that meets pseudocode and criteria .
Txt File below
input.txt file data
05 11/30/16
03 12/07/16
05 12/07/16
05 12/08/16
01 12/10/16
07 12/11/16
07 12/14/16
06 12/15/16
02 12/21/16
05 12/21/16
06 12/22/16
07 12/22/16
08 12/23/16
07 12/23/16
07 12/23/16
07 12/23/16
08 12/24/16
08 12/24/16
07 12/24/16
03 12/26/16
05 12/26/16
07 12/28/16
04 12/29/16
07 01/01/17
06 01/03/17
07 01/03/17
08 01/05/17
05 01/10/17
04 01/17/17
08 01/17/17
07 01/18/17
07...
How do i find the image height and width in SOF marker Segment( the Xthumbnail and...
 How do i find the image height and width in SOF marker
Segment( the Xthumbnail and Ythumbnail are all 0)?
Which is the resolution of the image
ff d8 ff e0 00 10 4a 46 49 46 00 01 01 01 00 c8
00 c8 00 00 ff db 00 43 00 02 02 02 02 02 01 02
02 02 02 02 02 02 03 03 06 04 03 03 03 03 07 05
05 04 06 08 07...
How do i find the image height and width in SOF marker
Segment( the Xthumbnail and Ythumbnail are all 0)?
Which is the resolution of the image
ff d8 ff e0 00 10 4a 46 49 46 00 01 01 01 00 c8
00 c8 00 00 ff db 00 43 00 02 02 02 02 02 01 02
02 02 02 02 02 02 03 03 06 04 03 03 03 03 07 05
05 04 06 08 07...
The data set below are the unemployment rates from April 2016 through March 2018. The mean...
 The data set below are the unemployment rates from April 2016 through March 2018. The mean unemployment rate is 4.5, the median unemployment rate is 4.5, and the standard deviation of 0.33. Describe the data set using these statistics. Does the data appear to be consistent on a monthly basis? Year/Month Unemployment rate 2016-04 5.0 2016-05 2016-06 2016-07 2016-08 2016-09 2016-10 2016-11 2016-12 2017-01 2017-02 2017-03 2017-04 MacBook Pro 2017-05 4.3 2017-06 4 2017-07 4.3 2017-08 4.4 2017-09 4.2 2017-10...
In a digital communication system, probability density function of the two level signal received in the...
 In a digital communication system, probability density function
of the two level signal received in the receiver is:
PR(v) =
PS(v)*PN(v) =
[0.4δ(v+1) + 0.6δ(v-4)]*η(v). And ,
η(v) is the noise that added to the message sign as the
additive Gaussian noise with a value of zero and an effective value
of 3.
(* symbol means convolution process, in the solution of this
problem you can use the below Q function table.) ,
η(v) =
A) Plot the probability density...
In a digital communication system, probability density function
of the two level signal received in the receiver is:
PR(v) =
PS(v)*PN(v) =
[0.4δ(v+1) + 0.6δ(v-4)]*η(v). And ,
η(v) is the noise that added to the message sign as the
additive Gaussian noise with a value of zero and an effective value
of 3.
(* symbol means convolution process, in the solution of this
problem you can use the below Q function table.) ,
η(v) =
A) Plot the probability density...
Nonlinear. Here we want you to verify this property by computing the output of S, for the followi...
 nonlinear. Here we want you to verify this property by computing the output of S, for the following two pairs of inputs. The S-box S is given as follows: 0-6. (10 points) One important property which makes DES secure is that the S-Boxes are S-box S S0 1 2 3 4 5 6 7 8 9 10 11 12 13 14 15 0 14 04 13 01 02 15 11 08 03 10 06 12 05 09 00 07 1...
Need help with C++ assignment Assignment 1 and .txt files are provided at the bottom. PART...
 Need help with C++ assignment
Assignment 1 and .txt files are provided at the
bottom.
PART A
PART B
Assignment
1
#include <iostream>
#include <string>
#include <fstream>
#include <iomanip>
#include <stdio.h>
#include <ctype.h>
#include <string.h>
#include <algorithm>
using namespace std;
/**
This structure is to store the date and it has three integer
fields
**/
struct Date{
int day;
int month;
int year;
};
/**
This structure is to store the size of the box and it...
Need help with C++ assignment
Assignment 1 and .txt files are provided at the
bottom.
PART A
PART B
Assignment
1
#include <iostream>
#include <string>
#include <fstream>
#include <iomanip>
#include <stdio.h>
#include <ctype.h>
#include <string.h>
#include <algorithm>
using namespace std;
/**
This structure is to store the date and it has three integer
fields
**/
struct Date{
int day;
int month;
int year;
};
/**
This structure is to store the size of the box and it...
Use the following tide table to answer the questions in the Assessing Your Learning section of...
 Use the following tide table to answer the questions in the
Assessing Your Learning section of this lab. This tide table shows
the predicted ocean heights for Santa Cruz/Monterey Bay, California
during December 2011.
1. A visit to Santa Cruz/Monterey Bay, California is planned
during the week of December 4-10 to view the tide pools. To observe
intertidal animals during the daytime at the lowest possible tide,
the best time to visit the beach is on _________________ at
_________________. (4...
Use the following tide table to answer the questions in the
Assessing Your Learning section of this lab. This tide table shows
the predicted ocean heights for Santa Cruz/Monterey Bay, California
during December 2011.
1. A visit to Santa Cruz/Monterey Bay, California is planned
during the week of December 4-10 to view the tide pools. To observe
intertidal animals during the daytime at the lowest possible tide,
the best time to visit the beach is on _________________ at
_________________. (4...
The Primary Key of the table recording this information is SheepID+WeighingDate. The table has not been...
The Primary Key of the table recording this information is SheepID+WeighingDate. The table has not been normalized beyond First Normal Form. That is, there are no ‘repeating groups’, but there may be Partial and Transitive Dependencies. SheepID Owner Birthdate WeighingDate Vet Weight VetPhoneNum K3922 McNab013 2013-05-12 2013-08-14 M330 22 7633088852 K3922 McNab013 2013-05-12 2014-06-02 S929 34 7609865463 K3922 McNab013 2013-05-12 2015-08-02 M330 43 7633088852 K3922 McNab013 2013-05-12 2016-07-30 P301 53 7682907965 K3922 McNab013 2013-05-12 2017-08-12 P301 52 7682907965 K3922 McNab013...
From the following labeled listing of individuals and the following excerpt from the random digits table B, select a simple random sample of size three. Circle the selected individuals. 3. 10. St...
 From the following labeled listing of individuals and the following excerpt from the random digits table B, select a simple random sample of size three. Circle the selected individuals. 3. 10. Stone 07. Smith LISTING: 01. Evenson 04. Jones 02. Buchanan 05. Hazan 06. Woods 11. Vigil 12. Morrison 08. Sanchez 09. Lin 03. Garcia EXCERPT: 21065 44902 37793 11384 20021 07498 06912 12009 45287 71753
From the following labeled listing of individuals and the following excerpt from the random...
From the following labeled listing of individuals and the following excerpt from the random digits table B, select a simple random sample of size three. Circle the selected individuals. 3. 10. Stone 07. Smith LISTING: 01. Evenson 04. Jones 02. Buchanan 05. Hazan 06. Woods 11. Vigil 12. Morrison 08. Sanchez 09. Lin 03. Garcia EXCERPT: 21065 44902 37793 11384 20021 07498 06912 12009 45287 71753
From the following labeled listing of individuals and the following excerpt from the random...
2020-03 136.6 2020-02 137.4 2020-01 136.8 2019-12 136.4 2019-11 136.4 2019-10 136.6 2019-09 136.2 2019-08 136.8...
 2020-03 136.6 2020-02 137.4 2020-01 136.8 2019-12 136.4 2019-11 136.4 2019-10 136.6 2019-09 136.2 2019-08 136.8 2019-07 137.0 2019-06 136.3 2019-05 136.6 2019-04 136.0 2019-03 135.4 2019-02 134.5 Rounded to one decimal place, the inflation rate over the period February 2019 to February 2020 was
 Need help writing a program that meets pseudocode and criteria .
Txt File below
input.txt file data
05 11/30/16
03 12/07/16
05 12/07/16
05 12/08/16
01 12/10/16
07 12/11/16
07 12/14/16
06 12/15/16
02 12/21/16
05 12/21/16
06 12/22/16
07 12/22/16
08 12/23/16
07 12/23/16
07 12/23/16
07 12/23/16
08 12/24/16
08 12/24/16
07 12/24/16
03 12/26/16
05 12/26/16
07 12/28/16
04 12/29/16
07 01/01/17
06 01/03/17
07 01/03/17
08 01/05/17
05 01/10/17
04 01/17/17
08 01/17/17
07 01/18/17
07...
Need help writing a program that meets pseudocode and criteria .
Txt File below
input.txt file data
05 11/30/16
03 12/07/16
05 12/07/16
05 12/08/16
01 12/10/16
07 12/11/16
07 12/14/16
06 12/15/16
02 12/21/16
05 12/21/16
06 12/22/16
07 12/22/16
08 12/23/16
07 12/23/16
07 12/23/16
07 12/23/16
08 12/24/16
08 12/24/16
07 12/24/16
03 12/26/16
05 12/26/16
07 12/28/16
04 12/29/16
07 01/01/17
06 01/03/17
07 01/03/17
08 01/05/17
05 01/10/17
04 01/17/17
08 01/17/17
07 01/18/17
07...
 The data set below are the unemployment rates from April 2016 through March 2018. The mean unemployment rate is 4.5, the median unemployment rate is 4.5, and the standard deviation of 0.33. Describe the data set using these statistics. Does the data appear to be consistent on a monthly basis? Year/Month Unemployment rate 2016-04 5.0 2016-05 2016-06 2016-07 2016-08 2016-09 2016-10 2016-11 2016-12 2017-01 2017-02 2017-03 2017-04 MacBook Pro 2017-05 4.3 2017-06 4 2017-07 4.3 2017-08 4.4 2017-09 4.2 2017-10...
 In a digital communication system, probability density function
of the two level signal received in the receiver is:
PR(v) =
PS(v)*PN(v) =
[0.4δ(v+1) + 0.6δ(v-4)]*η(v). And ,
η(v) is the noise that added to the message sign as the
additive Gaussian noise with a value of zero and an effective value
of 3.
(* symbol means convolution process, in the solution of this
problem you can use the below Q function table.) ,
η(v) =
A) Plot the probability density...
In a digital communication system, probability density function
of the two level signal received in the receiver is:
PR(v) =
PS(v)*PN(v) =
[0.4δ(v+1) + 0.6δ(v-4)]*η(v). And ,
η(v) is the noise that added to the message sign as the
additive Gaussian noise with a value of zero and an effective value
of 3.
(* symbol means convolution process, in the solution of this
problem you can use the below Q function table.) ,
η(v) =
A) Plot the probability density...
 nonlinear. Here we want you to verify this property by computing the output of S, for the following two pairs of inputs. The S-box S is given as follows: 0-6. (10 points) One important property which makes DES secure is that the S-Boxes are S-box S S0 1 2 3 4 5 6 7 8 9 10 11 12 13 14 15 0 14 04 13 01 02 15 11 08 03 10 06 12 05 09 00 07 1...
 Need help with C++ assignment
Assignment 1 and .txt files are provided at the
bottom.
PART A
PART B
Assignment
1
#include <iostream>
#include <string>
#include <fstream>
#include <iomanip>
#include <stdio.h>
#include <ctype.h>
#include <string.h>
#include <algorithm>
using namespace std;
/**
This structure is to store the date and it has three integer
fields
**/
struct Date{
int day;
int month;
int year;
};
/**
This structure is to store the size of the box and it...
Need help with C++ assignment
Assignment 1 and .txt files are provided at the
bottom.
PART A
PART B
Assignment
1
#include <iostream>
#include <string>
#include <fstream>
#include <iomanip>
#include <stdio.h>
#include <ctype.h>
#include <string.h>
#include <algorithm>
using namespace std;
/**
This structure is to store the date and it has three integer
fields
**/
struct Date{
int day;
int month;
int year;
};
/**
This structure is to store the size of the box and it...
 Use the following tide table to answer the questions in the
Assessing Your Learning section of this lab. This tide table shows
the predicted ocean heights for Santa Cruz/Monterey Bay, California
during December 2011.
1. A visit to Santa Cruz/Monterey Bay, California is planned
during the week of December 4-10 to view the tide pools. To observe
intertidal animals during the daytime at the lowest possible tide,
the best time to visit the beach is on _________________ at
_________________. (4...
Use the following tide table to answer the questions in the
Assessing Your Learning section of this lab. This tide table shows
the predicted ocean heights for Santa Cruz/Monterey Bay, California
during December 2011.
1. A visit to Santa Cruz/Monterey Bay, California is planned
during the week of December 4-10 to view the tide pools. To observe
intertidal animals during the daytime at the lowest possible tide,
the best time to visit the beach is on _________________ at
_________________. (4...
 From the following labeled listing of individuals and the following excerpt from the random digits table B, select a simple random sample of size three. Circle the selected individuals. 3. 10. Stone 07. Smith LISTING: 01. Evenson 04. Jones 02. Buchanan 05. Hazan 06. Woods 11. Vigil 12. Morrison 08. Sanchez 09. Lin 03. Garcia EXCERPT: 21065 44902 37793 11384 20021 07498 06912 12009 45287 71753
From the following labeled listing of individuals and the following excerpt from the random...
From the following labeled listing of individuals and the following excerpt from the random digits table B, select a simple random sample of size three. Circle the selected individuals. 3. 10. Stone 07. Smith LISTING: 01. Evenson 04. Jones 02. Buchanan 05. Hazan 06. Woods 11. Vigil 12. Morrison 08. Sanchez 09. Lin 03. Garcia EXCERPT: 21065 44902 37793 11384 20021 07498 06912 12009 45287 71753
From the following labeled listing of individuals and the following excerpt from the random...
 2020-03 136.6 2020-02 137.4 2020-01 136.8 2019-12 136.4 2019-11 136.4 2019-10 136.6 2019-09 136.2 2019-08 136.8 2019-07 137.0 2019-06 136.3 2019-05 136.6 2019-04 136.0 2019-03 135.4 2019-02 134.5 Rounded to one decimal place, the inflation rate over the period February 2019 to February 2020 was
Most questions answered within 3 hours.
-
Humans have used horses for transportation for millions of
years. Therefore, they will use horses for...
asked 44 minutes ago -
The following are the Jensen Corporation's unit costs of making
and selling an item at a...
asked 1 hour ago -
Does direct Medicare reimbursement of Advanced practice nurses
increase access to their services?
asked 2 hours ago -
List and explain why a company would choose to use a
published
compensation survey vs. creating...
asked 2 hours ago -
A discrete random variable X can take values from 1 to 10. Find
the variance of...
asked 2 hours ago -
The primary financial goal of a corporation is to maximize:
shareholders wealth.
earnings per share.
stock...
asked 2 hours ago -
determine whether the vectors u=(1,2,3,), v=(-2,1,0) and
w=(1,0,1) are linearly dependent or independent.
asked 2 hours ago -
python
Define a function called print_values which takes a dictionary
object as a parameter. The function...
asked 3 hours ago -
In Chapter 1 you created a program named Triangle in
which you displayed a seven-line triangle...
asked 3 hours ago -
Research question: What are the differences between separately
stated and non separately stated transactions in an...
asked 4 hours ago -
By using Arduino write a code that connects two LEDs to two
push-buttons. Each button controls...
asked 5 hours ago -
Bank of America has bonds that pay a coupon interest rate of 5.5
percent and mature...
asked 5 hours ago