In the 2016 presidential election Trump had 62,984,828 votes and Clinton had 65,853,514 votes. Test the...
- In the 2016 presidential election Trump had 62,984,828 votes and Clinton had 65,853,514 votes. Test the null hypothesis that there was a 50% chance of anyone randomly chosen voting for Trump.
Homework Answers
The  confidence interval for proportion is

Here  . The 95% confidence interval is
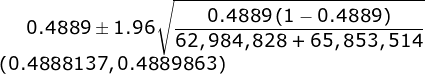
Since  , we reject the hypothesis that there was a 50% chance of anyone
randomly chosen voting for Trump.
, we reject the hypothesis that there was a 50% chance of anyone
randomly chosen voting for Trump.
Add Answer to:
In the 2016 presidential election Trump had 62,984,828 votes
and Clinton had 65,853,514 votes. Test the...
In the 1992 presidential election, Alaska's 40 election districts averaged 2154 votes per district for President Clinton
In the 1992 presidential election, Alaska's 40 election districts averaged 2154 votes per district for President Clinton. The standard deviation was 590. (There are only 40 election districts in Alaska.) The distribution of the votes per district for President Clinton was bell-shaped. Let X - number of votes for President Clinton for an election district. (Source: The World Almanac and Book of Facts) Round all answers except part e. to 4 decimal places. a. What is the distribution of X?b. Is...
In the 1992 presidential election, Alaska's 40 election districts averaged 1843 votes per district for President Clinton
In the 1992 presidential election, Alaska's 40 election districts averaged 1843 votes per district for President Clinton. The standard deviation was 571. (There are only 40 election districts in Alaska) The distribution of the votes per district for President Clinton was bell-shaped. Let X -number of votes for President Clinton for an election district. (Source: The World Almanac and Book of Facts) Round all answers except parte. to 4 decimal places. a. What is the distribution of X? b. Is 1843 a...
In the 1992 presidential election, Alaska's 40 election districts averaged 2118 votes per district for President...
In the 1992 presidential election, Alaska's 40 election districts averaged 2118 votes per district for President Clinton. The standard deviation was 577. (There are only 40 election districts in Alaska.) The distribution of the votes per district for President Clinton was bell-shaped. Let X = number of votes for President Clinton for an election district. (Source: The World Almanac and Book of Facts) Round all answers except part e. to 4 decimal places. a. What is the distribution of X?...
In the 1992 presidential election, Alaska's 40 election districts averaged 2010 votes per district for President...
In the 1992 presidential election, Alaska's 40 election districts averaged 2010 votes per district for President Clinton. The standard deviation was 574. (There are only 40 election districts in Alaska.) The distribution of the votes per district for President Clinton was bell-shaped. Let X = number of votes for President Clinton for an election district. (Source: The World Almanac and Book of Facts) Round all answers except part e. to 4 decimal places. a. What is the distribution of X?...
n the 1992 presidential election, Alaska's 40 election districts averaged 1962 votes per district for President...
n the 1992 presidential election, Alaska's 40 election districts averaged 1962 votes per district for President Clinton. The standard deviation was 592. (There are only 40 election districts in Alaska.) The distribution of the votes per district for President Clinton was bell-shaped. Let X = number of votes for President Clinton for an election district. (Source: The World Almanac and Book of Facts) Round all answers except part e. to 4 decimal places. a. What is the distribution of X?...
thanks In the 1992 presidential election, Alaska's 40 election districts averaged 2088 votes per district for...
 thanks
In the 1992 presidential election, Alaska's 40 election districts averaged 2088 votes per district for President Clinton. The standard deviation was 557. (There are only 40 election districts in Alaska.) The distribution of the votes per district for President Clinton was bell-shaped. Let X = number of votes for President Clinton for an election district. (Source: The World Almanac and Book of Facts) Round all answers except part e. to 4 decimal places. a. What is the distribution of...
thanks
In the 1992 presidential election, Alaska's 40 election districts averaged 2088 votes per district for President Clinton. The standard deviation was 557. (There are only 40 election districts in Alaska.) The distribution of the votes per district for President Clinton was bell-shaped. Let X = number of votes for President Clinton for an election district. (Source: The World Almanac and Book of Facts) Round all answers except part e. to 4 decimal places. a. What is the distribution of...
In the 1992 presidential election, Alaska's 40 election districts averaged 2021 votes per district for President...
In the 1992 presidential election, Alaska's 40 election districts averaged 2021 votes per district for President Clinton. The standard deviation was 559. (There are only 40 election districts in Alaska.) The distribution of the votes per district for President Clinton was bell-shaped. Let X = number of votes for President Clinton for an election district. (Source: The World Almanac and Book of Facts) Round all answers except part e. to 4 decimal places. a. What is the distribution of X?...
In the 1992 presidential election, Alaska's 40 election districts averaged 1902 votes per district for President...
 In the 1992 presidential election, Alaska's 40 election districts averaged 1902 votes per district for President Clinton. The standard deviation was 587. (There are only 40 election districts in Alaska.) The distribution of the votes per district for President Clinton was bell-shaped. Let X = number of votes for President Clinton for an election district. (Source: The World Almanac and Book of Facts) Round all answers except part e. to 4 decimal places. a. What is the distribution of X?...
Questions A-C a) In the 2012 Presidential Election Barack Obama received 51.1% of all votes cast....
Questions A-C a) In the 2012 Presidential Election Barack Obama received 51.1% of all votes cast. A polling organization polls 2500 selected randomly selected voters the week prior to the 2016 Republican convention to determine if the percentage of votes 2016 Republican nominee Donald Trump will receive less than Obama's 2012 percentage. Write out the hypotheses using proper notation. b) For b (i) draw the normal density curve, (ii) Place the appropriate value or values on the horizontal number line,...
Finding Binomial Probabilities National polls from October 2016 showed that preferences for the 2016 presidential election...
Finding Binomial Probabilities National polls from October 2016 showed that preferences for the 2016 presidential election differed along gender lines. Poll results showed that a greater percentage of likely female voters supported Clinton/Kaine, while a greater percentage of likely male voters supported Trump/Pence. A summary of poll results are shown in the table below. Men Women Clinton/Kaine 0.44 0.49 Trump/Pence 0.47 0.43 Based on this data, answer the following questions. Assume each person selected is independent from one another. Round...
 thanks
In the 1992 presidential election, Alaska's 40 election districts averaged 2088 votes per district for President Clinton. The standard deviation was 557. (There are only 40 election districts in Alaska.) The distribution of the votes per district for President Clinton was bell-shaped. Let X = number of votes for President Clinton for an election district. (Source: The World Almanac and Book of Facts) Round all answers except part e. to 4 decimal places. a. What is the distribution of...
thanks
In the 1992 presidential election, Alaska's 40 election districts averaged 2088 votes per district for President Clinton. The standard deviation was 557. (There are only 40 election districts in Alaska.) The distribution of the votes per district for President Clinton was bell-shaped. Let X = number of votes for President Clinton for an election district. (Source: The World Almanac and Book of Facts) Round all answers except part e. to 4 decimal places. a. What is the distribution of...
 In the 1992 presidential election, Alaska's 40 election districts averaged 1902 votes per district for President Clinton. The standard deviation was 587. (There are only 40 election districts in Alaska.) The distribution of the votes per district for President Clinton was bell-shaped. Let X = number of votes for President Clinton for an election district. (Source: The World Almanac and Book of Facts) Round all answers except part e. to 4 decimal places. a. What is the distribution of X?...
Most questions answered within 3 hours.
-
Create a Namespaces.h header file containing a namespace
declaration yourname. The declaration should include a method...
asked 5 minutes ago -
Herrod Catering uses two measures of activity, jobs and meals,
in the cost formulas in its...
asked 5 minutes ago -
Suppose a particle has zero potential energy for x
< 0, a constant value V, for...
asked 2 minutes ago -
As a technician in a large pharmaceutical research firm, you
need to produce 200. mL of...
asked 7 minutes ago -
how a person can still function with different parts
of the brain being damaged or removed
asked 9 minutes ago -
Cells that contain two of each of the chromosomes in a set are
known as:
Haploid...
asked 19 minutes ago -
The United States Department of Agriculture (USDA) found that
the proportion of young adults ages 20–39...
asked 22 minutes ago -
two part question: PLEASE ANSWER BOTH PARTS.
THANKS
A: Dyl Inc's bonds currently sell for $1,180...
asked 24 minutes ago -
What are the relationships and distinctions between
the exercise of power and compliance gaining?
asked 33 minutes ago -
A student ran the following reaction in the laboratory at
283 K:
2CH2Cl2(g)
->CH4(g) +
CCl4(g) ...
asked 35 minutes ago -
Write a Prolog program to find the maximum, minimum, and range
of values in a list...
asked 40 minutes ago -
def computeGrade(percentage):
'''
- Return the corresponding letter grade string
based on the value...
asked 39 minutes ago