Use the data in the table below to calculate Cp, Cpl, Cpu, and Cpk, assuming that the specificati...
|
Use the data in the table below to calculate Cp, Cpl, Cpu, and Cpk, assuming that the specifications are 3.75 ± 1.26. Do not round intermediate calculations. Round your answers to three decimal places.
Cp: Cpl: Cpu: Cpk: Construct the frequency distribution for the data. For calculating the cell width assume 8 cells, the lower limit of 2.49 inches and upper limit of 5.01 inches. If your answer is zero, enter "0". Round your answers for interval boundaries to three decimal places and round your answers for frequencies to the nearest whole number.
Choose the correct histogram for the data. The correct histogram is _______ .
|
|||||||||||||||||||||||||||||||||||||||||||||||||||||||||||||||||||||||||||||||||||||||||||||||||||||||||||||||||||||||||||||||||||||||||||||||||||||||||||||||||||||||||||||||||||||||||||||||||||||||||||||||||


Homework Answers
Given details
Upper specification limit = 3.75
Lower specification limit = 1.26
Step 1:
Calculate Average(X-bar) and standard deviation for the given sample data.
- First calculate the average for each subgroup. Enter the "=Average(B3:AE3)" in AF3 cell and the copy the forumla till AF5 cell.
- To calculate the Average (X-bar), enter = "Average(AF3:AF5)" in any cell. Average (X-bar) = 3.63
- To calculate the standard deviation, enter = "STDEV(AF3:AF5)" in any cell. Standard deviation = 0.14
Table 1 - average of X-bar and standard
deviation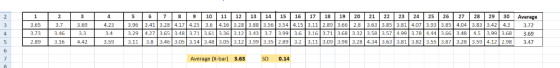
Step 2:
Calculate Cp, Cpl, Cpu, and Cpk


= Min ( 0.107,0.299) = 0.107
Step3:
Given lower limit = 2.49 and upper limit = 5.01
Steps to construct frequency distribution table
- Data range for frequency calculation is B3:AE5
- Enter the class intervals in the cell range C11 to D19
- Enter the formula in cell H for frequency distribution
- Cell E11: =COUNTIFS($B$3:$AE$5,">0",$B$3:$AE$5,"<=2.49")
- Cell E12: =COUNTIFS($B$3:$AE$5,">2.49",$B$3:$AE$5,"<=2.80")
- Cell E13: =COUNTIFS($B$3:$AE$5,">2.80",$B$3:$AE$5,"<=3.12")
- Cell E14: =COUNTIFS($B$3:$AE$5,">3.12",$B$3:$AE$5,"<=3.43")
- Cell E15: =COUNTIFS($B$3:$AE$5,">3.43",$B$3:$AE$5,"<=3.75")
- Cell E16: =COUNTIFS($B$3:$AE$5,">3.75",$B$3:$AE$5,"<=4.06")
- Cell E17: =COUNTIFS($B$3:$AE$5,">4.06",$B$3:$AE$5,"<=4.38")
- Cell E18: =COUNTIFS($B$3:$AE$5,">4.38",$B$3:$AE$5,"<=4.69")
- Cell E19: =COUNTIFS($B$3:$AE$5,">4.69",$B$3:$AE$5,"<=5.01")
The result of frequency table and relevant graph is shown below
Table 2 - frequency table

Therefore, the correct answer is D.
Add Answer to:
Use the data in the table below to calculate Cp, Cpl, Cpu, and Cpk, assuming that the specificati...
The median wage for economics degree holders is determined by the following equation: log( wage) = Be...
 The median wage for economics degree holders is determined by the following equation: log( wage) = Be + B educ + B, exper+ B temure + B.age+ B married + u where educ is the level of education measured in years, exper is the job-market experience in years, tenure is the time spend with the current company in years, age is the age in years and married is a dummy variable indicating if a person is married. 935 reg Iwage...
REGRESSION 2 • reg bught cigs faminc male Source SS df MS = = Model Residual...
 REGRESSION 2 • reg bught cigs faminc male Source SS df MS = = Model Residual 20477.12 554134.6 3 6825.70666 1,384 400.386272 Number of obs F(3, 1384) Prob > R-squared Adj R-squared Root MSE 1,388 17.05 0.0000 0.0356 0.0335 20.01 - Total 574611.72 1,387 414.283864 bwght Coef. Std. Err. Piti (95Conf. Intervall cigs famine male _cons -.4610457 0913378 .09687980291453 3.113968 1.076396 115.2277 1.20788 -5.050.000 3.32 0.001 2.89 0.004 95.400.000 -.6402212 .0397062 1.002423 112.8582 - 2818702 .1540535 5.225513 117.5972 f) Conduct...
1. Two manufacturing processes are being compared to try to reduce the number of defective products...
 1. Two manufacturing processes are being compared to try to reduce the number of defective products made. During 8 shifts for each process, the following results were observed: Line A Line B n 181 | 187 Based on a 5% significance level, did line B have a larger average than line A? *Use the tables I gave you in the handouts for the critical values *Use the appropriate test statistic value, NOT the p-value method *Use and show the 5...
Write the C program, to achieve as shown in the sample code execution, using the given...
Write the C program, to achieve as shown in the sample code execution, using the given struct and using the comments in the given main program below: typedef struct{ char first[20]; char last[20]; float gpa; int score; } student; int main(void){ student *ptr; //first name //last name //student gpa //student score } //ask a user to enter the number of students, num //dynamically allocate memory for an array of students of the appropriate size (i.e. //num that the user just...
ample Data Item 1 2 3 4 5 Group 1 Group 2 Group 3 13 19...
 ample Data Item 1 2 3 4 5 Group 1 Group 2 Group 3 13 19 16 13 18 14 13 19 16 13 19 15 12 18 15 Print Done p=0.95 D 2 4 5 6 7 8 9 10 D 2 4 5 6 7 8 9 10 11 12 1797 6.08 4.50 3.93 3.64 3.46 3.34 3.26 3.20 3.15 3.11 3.08 3.06 3.03 3.01 3.00 2.98 2.97 2.96 2.95 2.92 2.89 2.86 2.83 2.80 2.77 13 14...
The subjects in the data are college students. In the data, id is student ID, anxiety...
The subjects in the data are college students. In the data, id is student ID, anxiety is student’s anxiety score via Anxiety Scale, selfest is student’s self-esteem score via Rosenberg Self-esteem Scale, GPA is student’s GPA; for gender, 0=female, 1=male; for grade, 1=freshman, 2=junior, 3=senior. We have known that population mean for Anxiety Scale is μ=60 with σ=10. Raise relevant questions ( 2 questions is fine) about the data extensively, the questions can be either about descriptive analysis or inferential...
Gain (V/V) R Setting Totals Averages Sample 1 Sample 2 Sample 3 4 ап 7.8 8.1...
 Gain (V/V) R Setting Totals Averages Sample 1 Sample 2 Sample 3 4 ап 7.8 8.1 7.9 3 5.2 6.0 4.3 = 359.3 i=1 j=1 2 4.4 6.9 3.8 1 2.0 1.7 0.8 This is actual data from one of Joe Tritschler's audio engineering experiments. Use Analysis of Variance (ANOVA) to test the null hypothesis that the treatment means are equal at the a = 0.05 level of significance. Fill in the ANOVA table. Source of Variation Sum of Squares...
Suppose 1000 coins are tossed. Use the normal curve approximation to the binomial distribution to find...
 Suppose 1000 coins are tossed. Use the normal curve approximation to the binomial distribution to find the probability of getting the following result. Exactly 495 heads Use the table of areas under the standard normal curve given below. Click here to view page 1. Click here to view page 2. Click here to view page 3. Click here to view page 4. Click here to view page 5. Click here to view page 6. The probability of getting exactly 495...
Suppose 16 coins are tossed. Use the normal curve approximation to the binomial distribution to find...
 Suppose 16 coins are tossed. Use the normal curve approximation to the binomial distribution to find the probability of getting the following result. More than 11 tails. Use the table of areas under the standard normal curve given below. Click here to view page 1. Click here to view page 2. Click here to view page 3. Click here to view page 4. Click here to view page 5. Click here to view page 6. Binomial probability = (Round to...
 The median wage for economics degree holders is determined by the following equation: log( wage) = Be + B educ + B, exper+ B temure + B.age+ B married + u where educ is the level of education measured in years, exper is the job-market experience in years, tenure is the time spend with the current company in years, age is the age in years and married is a dummy variable indicating if a person is married. 935 reg Iwage...
 REGRESSION 2 • reg bught cigs faminc male Source SS df MS = = Model Residual 20477.12 554134.6 3 6825.70666 1,384 400.386272 Number of obs F(3, 1384) Prob > R-squared Adj R-squared Root MSE 1,388 17.05 0.0000 0.0356 0.0335 20.01 - Total 574611.72 1,387 414.283864 bwght Coef. Std. Err. Piti (95Conf. Intervall cigs famine male _cons -.4610457 0913378 .09687980291453 3.113968 1.076396 115.2277 1.20788 -5.050.000 3.32 0.001 2.89 0.004 95.400.000 -.6402212 .0397062 1.002423 112.8582 - 2818702 .1540535 5.225513 117.5972 f) Conduct...
 1. Two manufacturing processes are being compared to try to reduce the number of defective products made. During 8 shifts for each process, the following results were observed: Line A Line B n 181 | 187 Based on a 5% significance level, did line B have a larger average than line A? *Use the tables I gave you in the handouts for the critical values *Use the appropriate test statistic value, NOT the p-value method *Use and show the 5...
 ample Data Item 1 2 3 4 5 Group 1 Group 2 Group 3 13 19 16 13 18 14 13 19 16 13 19 15 12 18 15 Print Done p=0.95 D 2 4 5 6 7 8 9 10 D 2 4 5 6 7 8 9 10 11 12 1797 6.08 4.50 3.93 3.64 3.46 3.34 3.26 3.20 3.15 3.11 3.08 3.06 3.03 3.01 3.00 2.98 2.97 2.96 2.95 2.92 2.89 2.86 2.83 2.80 2.77 13 14...
 Gain (V/V) R Setting Totals Averages Sample 1 Sample 2 Sample 3 4 ап 7.8 8.1 7.9 3 5.2 6.0 4.3 = 359.3 i=1 j=1 2 4.4 6.9 3.8 1 2.0 1.7 0.8 This is actual data from one of Joe Tritschler's audio engineering experiments. Use Analysis of Variance (ANOVA) to test the null hypothesis that the treatment means are equal at the a = 0.05 level of significance. Fill in the ANOVA table. Source of Variation Sum of Squares...
 Gain (V/V) R Setting Totals Averages Sample 1 Sample 2 Sample 3 4 ап 7.8 8.1 7.9 3 5.2 6.0 4.3 = 359.3 i=1 j=1 2 4.4 6.9 3.8 1 2.0 1.7 0.8 This is actual data from one of Joe Tritschler's audio engineering experiments. Use Analysis of Variance (ANOVA) to test the null hypothesis that the treatment means are equal at the a = 0.05 level of significance. Fill in the ANOVA table. Source of Variation Sum of Squares...
 Suppose 1000 coins are tossed. Use the normal curve approximation to the binomial distribution to find the probability of getting the following result. Exactly 495 heads Use the table of areas under the standard normal curve given below. Click here to view page 1. Click here to view page 2. Click here to view page 3. Click here to view page 4. Click here to view page 5. Click here to view page 6. The probability of getting exactly 495...
 Suppose 16 coins are tossed. Use the normal curve approximation to the binomial distribution to find the probability of getting the following result. More than 11 tails. Use the table of areas under the standard normal curve given below. Click here to view page 1. Click here to view page 2. Click here to view page 3. Click here to view page 4. Click here to view page 5. Click here to view page 6. Binomial probability = (Round to...
Most questions answered within 3 hours.
-
By applying what you know about Grignard reagents and the
mechanism by which benzoic acid is...
asked 11 minutes ago -
For thermoplastics, explain the effects of increasing of each of
the following properties on a polymer’s...
asked 12 minutes ago -
Make a menu for the user to use in python 3 that can search and
replace...
asked 2 minutes ago -
1) An aqueous solution contains 0.280 M
NaHS and 0.128 M
H2S.
The pH of this...
asked 18 minutes ago -
Situational Leadership
is based on interplay of all of the following except:
The amount of guidance...
asked 18 minutes ago -
Consider the following problem: given n positive integers,
separate them into two groups such that adding...
asked 22 minutes ago -
Briefly discuss the following statements:
2.1 A partner never has the right to claim compensation for...
asked 24 minutes ago -
If a bond has an annual probability of default of 6%, 10% and
12% in years...
asked 33 minutes ago -
Let X be normally distributed with mean μ = 10 and standard
deviation σ = 6....
asked 38 minutes ago -
You're examining some of the tiny printing on one of the newer
twenty-dollar bills. A 1.5...
asked 43 minutes ago -
Discuss several common sources of secondary data coming from
government sources.
asked 45 minutes ago -
This is a basic java program where you convert units using only
loops, control statements and...
asked 46 minutes ago