


12. For the data in the table, how many data points are in each group for the median-median line? xr 2.5 6 7.5 8 8 10 9 11 9 13 12 2 11.5 9 15 11 16 15 20 20 21.5 24 22.5 25 left: 4, center: 8, right: 4 left: 5, center: 5,right: 5 left. 5, center: 6, right: 5 left: 7, center: 2, right: 7
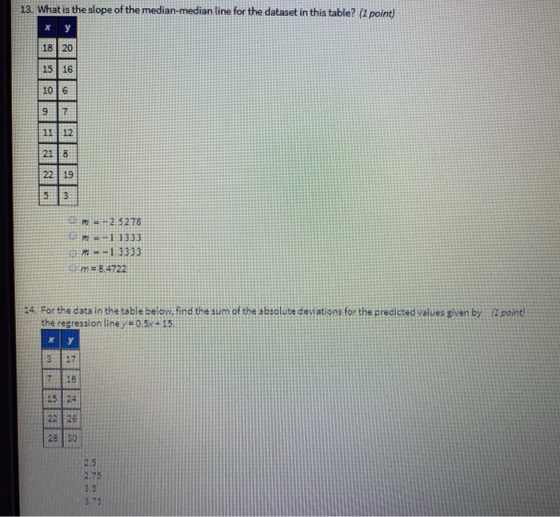
13. What is the slope of the median-median line for the dataset in this table? (1 point) 15 16 ::..。.m-2.5278 OMe-1 1333 m-1 3333 m84722 14. For the data in the table below, find the sum of the sbsolute deviations for the predicted values given by point the regression liney 05x+15 718 22 26 2.5 2.75 3.75
15. Find the three median.x-values that would form the summary points of the median-median line for the (l point) dataset in the table =25,z,-85,x, # 16.5 04=2,4°9,4°16.5 16. Construct a scatterplot and identify the mathematical model that best fits the data. Assume that 1 point the model is to be used only for the scope of the given data and consider only linear, quadratic, logarithmic, exponential, and power models. Use a calculator or computer to obtain the regression equation of the model that best fits the data. You may need to fit several models and compare the values of R2 x6 8 19 21 41 v16 19 130 153 521 y-477.38+237.66 Inx y11.46 e1107% y-109.41+14.59)x .5 , 589 6 6 8 8 6 7 1 2 3 8 9
17. IfS8 000 is invested at an annual interest rate of 1.83%, compounded daily, what will the investment be Ipo worth after 10 years? O S9,605.18 o $9,602.51 o $9,606.41 o $9,590.64 18. Construct a scatterplot and identify the mathematical model that best fits the data. Assume that (1 po the model is to be used only for the scope of the given data and consider only linear, quadratic, logarithmic, exponential, and power models. Use a calculator or computer to obtain the regression equation of the model that best fits the data. You may need to fit several models and compare the values of R2 x1 2 3 4 5 6 9 13 25 27 31 46 y 487 +18.5 Inx -o y = 8.34x0.88 :0 y 1.07 + 6.89x Oy#3.14 +6.53x 19. Find a recursive formula for the sequence: (4 point) 3. -5.11,-21
20. A collection of paired data consists of the number of years that students have studied Spanish and (ipoin their scores on a Spanish language proficiency test. A computer program was used to obtain the least squares linear regression line and the computer output is shown below. Along with the paired sample data, the program was also given an x value of 2 (years of study) to be used for predicting test score. Equation: y mx + b Statistics: 0.83 0.91 Parameters: M-10.90 b31.55 Answer the following questions based on the information given above. Use theinformation in the display to find the value of the linear correlation coefficientr. Determine level of 0.05.There are 10 pairs of data. ther there is significant linear correlation between years of study and teat acores. Use a significance r С.83, Ther is ro significant linear correlation r#0.92,There is no significant inear correlation r-O.S1, There is significant linear correlation. r. О.83; Ther tsigrificantii near correlation
Homework Answers
Question 11
Using Minitab:
Using Excel scatter Plot:
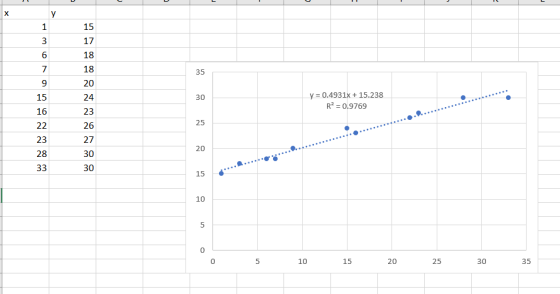
As per the given data y-intercepts shows 15.24. In given option 15.14 may be correct option.
Please post remaining questions separately. Hope this will be helpful. Thanks and god Bless You :)
Add Answer to:
My last question has gone hours without being answered, so I am submitting these again. Anyone wh...
The table below gives the number of hours five randomly selected students spent studying and their...
 The table below gives the number of hours five randomly selected students spent studying and their corresponding midterm exam grades. Using this data, consider the equation of the regression line, y = bo + b x, for predicting the midterm exam grade that a student will earn based on the number of hours spent studying. Keep in mind, the correlation coefficient may or may not be statistically significant for the data given. Remember, in practice, it would not be appropriate...
STATS QUESTION PLEASE ONLY ANSWER G, H, and I. I have everything else answered 50 Points...
 STATS QUESTION PLEASE ONLY ANSWER G, H, and I. I have everything
else answered
50 Points Total Percentages of public school students in fourth grade in 1996 and in eighth grade in 2000 who were at or above the proficient level in mathematics were given in the article "Mixed Progress In Math” (USA Today, August 3, 2001). The following data for eight Western states were given: State Arizona (AZ) California (CA) Hawaii (HI) Montana (MT) New Mexico (NM) Oregon (OR)...
STATS QUESTION PLEASE ONLY ANSWER G, H, and I. I have everything
else answered
50 Points Total Percentages of public school students in fourth grade in 1996 and in eighth grade in 2000 who were at or above the proficient level in mathematics were given in the article "Mixed Progress In Math” (USA Today, August 3, 2001). The following data for eight Western states were given: State Arizona (AZ) California (CA) Hawaii (HI) Montana (MT) New Mexico (NM) Oregon (OR)...
The table below gives the number of hours spent unsupervised each day as well as the...
 The table below gives the number of hours spent unsupervised each day as well as the overall grade averages for seven randomly selected middle school students. Using this data, consider the equation of the regression line, y - bo t bix. for predicting the overall grade average for a middle school student based on the number of hours spent unsupervised each day Keep in mind, the correlation coefficient may or may not be statistically significant for the data given. Remember,...
i neeed help for my qz2 this one is visual basic , i dont understand how...
 i neeed help for my qz2
this one is visual basic , i dont understand how to write
code
QZ2: Linear Regression (100 points) Given: A data table (see next page) Find: 1. Use one-dimensional array to find the equation of least-squares-fit line (slope and y-intercept; 10 points each), correlation coefficient and coefficient of the determination (10 points each) 2. Use two-dimensional array to find the equation of least-squares-fit line (slope and y-intercept; 10 points each), correlation coefficient and coefficient...
i neeed help for my qz2
this one is visual basic , i dont understand how to write
code
QZ2: Linear Regression (100 points) Given: A data table (see next page) Find: 1. Use one-dimensional array to find the equation of least-squares-fit line (slope and y-intercept; 10 points each), correlation coefficient and coefficient of the determination (10 points each) 2. Use two-dimensional array to find the equation of least-squares-fit line (slope and y-intercept; 10 points each), correlation coefficient and coefficient...
The table below gives the number of hours ten randomly selected students spent studyling and their...
 The table below gives the number of hours ten randomly selected students spent studyling and their corresponding midterm exam grades. Using this data, consider the equation of the regression line, -bo +bix, for predicting the midterm exam grade that a student will earn based on the number of hours spent studying. Keep in mind, the correlation coefficient may or may not be statistically significant for the data given. Remember, in practice, it would not be appropriate to use the regression...
The table below gives the number of hours spent unsupervised each day as well as the...
The table below gives the number of hours spent unsupervised each day as well as the overall grade averages for seven randomly selected middle school students. Using this data, consider the equation of the regression line, yˆ=b0+b1xy^=b0+b1x, for predicting the overall grade average for a middle school student based on the number of hours spent unsupervised each day. Keep in mind, the correlation coefficient may or may not be statistically significant for the data given. Remember, in practice, it would...
The table below gives the number of hours spent unsupervised each day as well as the...
 The table below gives the number of hours spent unsupervised each day as well as the overall grade averages for seven randomly selected middle school students. Using this data, consider the equation of the regression line.ỹ = bo + bx for predicting the overall grade average for a middle school student based on the number of hours spent unsupervised each day. Keep in mind, the correlation coefficient may or may not be statistically significant for the data given. Remember, in...
Question 2 - of 24 Step 5 of 6 02:19:07 The table below gives the list...
 Question 2 - of 24 Step 5 of 6 02:19:07 The table below gives the list price and the number of bids received for five randomly selected items sold through online auctions. Using this data. consider the equation of the regression line 9 = bo + bix. for predicting the number of bids an item will receive based on the list price. Keep in mind, the correlation coefficient may or may not be statistically significant for the data given. Remember,...
The table below gives the number of hours spent unsupervised each day as well as the...
The table below gives the number of hours spent unsupervised each day as well as the overall grade averages for seven randomly selected middle school students. Using this data, consider the equation of the regression line, yˆ=b0+b1x, for predicting the overall grade average for a middle school student based on the number of hours spent unsupervised each day. Keep in mind, the correlation coefficient may or may not be statistically significant for the data given. Remember, in practice, it would...
Please help with multi step question- 1 question with 6 parts!! The table below gives the...
 Please help with multi step question- 1 question with 6
parts!!
The table below gives the number of hours seven randomly selected students spent studying and their corresponding midterm exam grades. Using this data, consider the equation of the regression line, y bo + bix, for predicting the midterm exam grade that a student will earn based on the number of hours spent studying. Keep in mind, the correlation coefficient may or may not be statistically significant for the data...
Please help with multi step question- 1 question with 6
parts!!
The table below gives the number of hours seven randomly selected students spent studying and their corresponding midterm exam grades. Using this data, consider the equation of the regression line, y bo + bix, for predicting the midterm exam grade that a student will earn based on the number of hours spent studying. Keep in mind, the correlation coefficient may or may not be statistically significant for the data...
 The table below gives the number of hours five randomly selected students spent studying and their corresponding midterm exam grades. Using this data, consider the equation of the regression line, y = bo + b x, for predicting the midterm exam grade that a student will earn based on the number of hours spent studying. Keep in mind, the correlation coefficient may or may not be statistically significant for the data given. Remember, in practice, it would not be appropriate...
 STATS QUESTION PLEASE ONLY ANSWER G, H, and I. I have everything
else answered
50 Points Total Percentages of public school students in fourth grade in 1996 and in eighth grade in 2000 who were at or above the proficient level in mathematics were given in the article "Mixed Progress In Math” (USA Today, August 3, 2001). The following data for eight Western states were given: State Arizona (AZ) California (CA) Hawaii (HI) Montana (MT) New Mexico (NM) Oregon (OR)...
STATS QUESTION PLEASE ONLY ANSWER G, H, and I. I have everything
else answered
50 Points Total Percentages of public school students in fourth grade in 1996 and in eighth grade in 2000 who were at or above the proficient level in mathematics were given in the article "Mixed Progress In Math” (USA Today, August 3, 2001). The following data for eight Western states were given: State Arizona (AZ) California (CA) Hawaii (HI) Montana (MT) New Mexico (NM) Oregon (OR)...
 The table below gives the number of hours spent unsupervised each day as well as the overall grade averages for seven randomly selected middle school students. Using this data, consider the equation of the regression line, y - bo t bix. for predicting the overall grade average for a middle school student based on the number of hours spent unsupervised each day Keep in mind, the correlation coefficient may or may not be statistically significant for the data given. Remember,...
 i neeed help for my qz2
this one is visual basic , i dont understand how to write
code
QZ2: Linear Regression (100 points) Given: A data table (see next page) Find: 1. Use one-dimensional array to find the equation of least-squares-fit line (slope and y-intercept; 10 points each), correlation coefficient and coefficient of the determination (10 points each) 2. Use two-dimensional array to find the equation of least-squares-fit line (slope and y-intercept; 10 points each), correlation coefficient and coefficient...
i neeed help for my qz2
this one is visual basic , i dont understand how to write
code
QZ2: Linear Regression (100 points) Given: A data table (see next page) Find: 1. Use one-dimensional array to find the equation of least-squares-fit line (slope and y-intercept; 10 points each), correlation coefficient and coefficient of the determination (10 points each) 2. Use two-dimensional array to find the equation of least-squares-fit line (slope and y-intercept; 10 points each), correlation coefficient and coefficient...
 The table below gives the number of hours ten randomly selected students spent studyling and their corresponding midterm exam grades. Using this data, consider the equation of the regression line, -bo +bix, for predicting the midterm exam grade that a student will earn based on the number of hours spent studying. Keep in mind, the correlation coefficient may or may not be statistically significant for the data given. Remember, in practice, it would not be appropriate to use the regression...
 The table below gives the number of hours spent unsupervised each day as well as the overall grade averages for seven randomly selected middle school students. Using this data, consider the equation of the regression line.ỹ = bo + bx for predicting the overall grade average for a middle school student based on the number of hours spent unsupervised each day. Keep in mind, the correlation coefficient may or may not be statistically significant for the data given. Remember, in...
 Question 2 - of 24 Step 5 of 6 02:19:07 The table below gives the list price and the number of bids received for five randomly selected items sold through online auctions. Using this data. consider the equation of the regression line 9 = bo + bix. for predicting the number of bids an item will receive based on the list price. Keep in mind, the correlation coefficient may or may not be statistically significant for the data given. Remember,...
 Please help with multi step question- 1 question with 6
parts!!
The table below gives the number of hours seven randomly selected students spent studying and their corresponding midterm exam grades. Using this data, consider the equation of the regression line, y bo + bix, for predicting the midterm exam grade that a student will earn based on the number of hours spent studying. Keep in mind, the correlation coefficient may or may not be statistically significant for the data...
Please help with multi step question- 1 question with 6
parts!!
The table below gives the number of hours seven randomly selected students spent studying and their corresponding midterm exam grades. Using this data, consider the equation of the regression line, y bo + bix, for predicting the midterm exam grade that a student will earn based on the number of hours spent studying. Keep in mind, the correlation coefficient may or may not be statistically significant for the data...
Most questions answered within 3 hours.
-
For the data set shown below, complete parts (a) through (d)
below. x 3 4 5...
asked 12 seconds ago -
A university administrator working in student housing wants to
determine if the percentage of students residing...
asked 14 minutes ago -
3). Describe human population growth that has occurred in the
past 400 years. Use terms learned...
asked 11 minutes ago -
A
projectile is blue at a target. The distance from the point of
impact to the...
asked 35 minutes ago -
Given a 32 bit processor, with 2 MB of physical RAM split into 512
frames. What...
asked 26 minutes ago -
What were the main rulings in the Supreme Court cases which are
Morgan v. Virginia (1946)...
asked 25 minutes ago -
write a five paragraph essay on how setting,
specifically culture, influences the actions of
the characters...
asked 17 minutes ago -
JAVA
Provide a simple code sample of Merge sort
asked 27 minutes ago -
Discounting cash flows involves:
A. taking the cash discount offered on a trade merchandise
B. estimating...
asked 35 minutes ago -
A solid wood door 1.00 m wide and 2.00 m high is hinged along
one side...
asked 35 minutes ago -
Raleigh Company manufactures two joint products. At the
split-off point, they have sales values of:
Product...
asked 34 minutes ago -
1. Your grandmother has invested $4000 in a mutual fund each
year on your birthday (she...
asked 36 minutes ago