
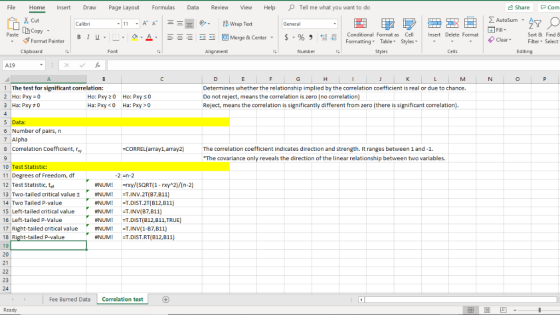
File Home Insert Draw Page Layout Formulas t view View Help Tell me what you want to do 四share -Com AutoSum A 多, Wrap Text General Copy Paste Conditional Format as Cell Insert Delete Format Sort &Find & .Format Painter Formatting Table StylesClear Filter Select Clipboard Font Alignment Styles Cells Editing 1The test for significant correlation: Determines whether the relationship implied by the correlation coefficient is real or due to chance Do not reject, means the correlation is zero (no correlation) Reject, means the correlation is significantly different from zero (there is significant correlation) 5 Data: Number of pairs, n 7 Alpha 8 Correlation Coefficient, r -CORREL(array1,array2) The correlation coefficient indicates direction and strength. It ranges between 1 and -1. The covariance only reveals the direction of the linear relationship between two variables. 10 Test Statistic: 11 Degrees of Freedom, df 12 Test Statistic, tf 13 Two-tailed critical value- 14 Two Tailed P-value 15 Left-tailed critical value 16 Left-tailed P-Value 17 Right-tailed critical value 18 Right-tailed P-value 19 20 21 2 n-2 , ANUM! NUM! #NUM #NUMl #NUM! 赮UM! T.INV.2t(B7, B11) T.DIST.2T(B12,B11) -T.INVfB7B11) -T. DIST(B12,B11,TRUE) -T.INVf1-B7,B11) -T.DIST.RT(B12B11) ' | 23 Fee Burned DataCorrelation test Ready
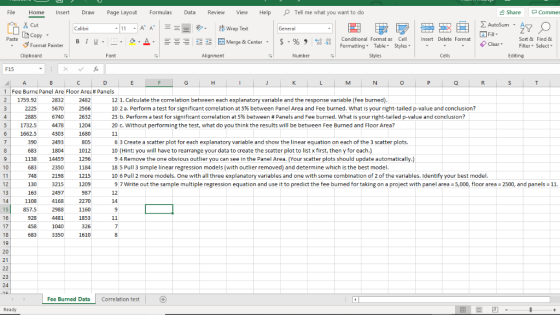
File Home Inser Draw Page Layout Formulas Data Review View Help Tell me what you want to do Share P Commer Σ AutoSum . A Copy Format Painter Paste conditional Fo matas tyles. Insert Delete Format B 1 u . . 오. .- --E t Merge & Center . s-% , +58 Fort& Selec& Clear. Formatting Table" ▼ Filter- Select" Font Alignment Number Editing 0 1 Fee Burne Panel Are Floor Area # Panels 2 1759.92 22225 67401204 12 1. Calculate the correlation between each explanatory variable and the response variable (fee burned 10 2 a. Perform a test for significant correlation at 5% between Panel Area and Fee burned, what is your right-tailed p-value and conclusion? 23 b, perform a test for significant correlation at 5% between # Panels and Fee burned. What is your right-tailed p-value and conclusion? 20 C. Without performing the test, what do you think the results will be between Fee Burned and Floor Area? 5670 5 1732.5 4478 6 1662.5 4303 2493 1012 90 1804 1296 6 3 Create a scatter plot for each explanatory variable and show the linear equation on each of the 3 scatter plots 10 (Hint: you will have to rearrange your data to create the scatter plot to list x first, then y for each.) 9 4 Remove the one obvious outlier you can see in the Panel Area. (Your scatter plots should update automatically 18 5 Pull 3 simple linear regression models (with outlier removed) and determine which is the best model. 10 Pull 2 more models. One with all three explanatory variables and one with some combination of 2 of the variables. Identify your best model. 9 7 Write othe sample multiple regression equation and use it to predict the fee burned for taking on a project with panel area 5,000, floor area 2500, and panels 11. 113814459 10 2350 51108 2491209 4168 12 130 987 2270 1160 14 15 16 17 18 19 20 857.5 928 4481 3350 1610 24 Fee Burned Data Correlation test |
Homework Answers
1.between free burned(y) and panel area (X1)
X Values
∑ = 69066
Mean = 4062.706
∑(X - Mx)2 = SSx =
147711085.529
Y Values
∑ = 18234.42
Mean = 1072.613
∑(Y - My)2 = SSy =
9061658.29
X and Y Combined
N = 17
∑(X - Mx)(Y - My) = 14711481.545
R Calculation
r = ∑((X - My)(Y - Mx)) /
√((SSx)(SSy))
r = 14711481.545 / √((147711085.529)(9061658.29)) = 0.4021
Meta Numerics (cross-check)
r = 0.4021
Key
X: X Values
Y: Y Values
Mx: Mean of X Values
My: Mean of Y Values
X - Mx & Y -
My: Deviation scores
(X - Mx)2 & (Y -
My)2: Deviation
Squared
(X - Mx)(Y -
My): Product of Deviation Scores
The value of R is 0.4021.
Although technically a positive correlation, the relationship between your variables is weak (nb. the nearer the value is to zero, the weaker the relationship).
between free burned (y) and floor area(X2)
X Values
∑ = 25491
Mean = 1499.471
∑(X - Mx)2 = SSx =
7017316.235
Y Values
∑ = 18234.42
Mean = 1072.613
∑(Y - My)2 = SSy =
9061658.29
X and Y Combined
N = 17
∑(X - Mx)(Y - My) = 6201663.956
R Calculation
r = ∑((X - My)(Y - Mx)) /
√((SSx)(SSy))
r = 6201663.956 / √((7017316.235)(9061658.29)) = 0.7777
Meta Numerics (cross-check)
r = 0.7777
Key
X: X Values
Y: Y Values
Mx: Mean of X Values
My: Mean of Y Values
X - Mx & Y -
My: Deviation scores
(X - Mx)2 & (Y -
My)2: Deviation
Squared
(X - Mx)(Y -
My): Product of Deviation Scores
The value of R is 0.7777.
This is a strong positive correlation, which means that high X variable scores go with high Y variable scores (and vice versa).
between free burned (y) and # panel(X3)
X Values
∑ = 199
Mean = 11.706
∑(X - Mx)2 = SSx = 341.529
Y Values
∑ = 18234.42
Mean = 1072.613
∑(Y - My)2 = SSy =
9061658.29
X and Y Combined
N = 17
∑(X - Mx)(Y - My) = 33631.065
R Calculation
r = ∑((X - My)(Y - Mx)) /
√((SSx)(SSy))
r = 33631.065 / √((341.529)(9061658.29)) = 0.6045
Meta Numerics (cross-check)
r = 0.6045
Key
X: X Values
Y: Y Values
Mx: Mean of X Values
My: Mean of Y Values
X - Mx & Y -
My: Deviation scores
(X - Mx)2 & (Y -
My)2: Deviation
Squared
(X - Mx)(Y -
My): Product of Deviation Scores
The value of R is 0.6045.
This is a moderate positive correlation, which means there is a tendency for high X variable scores go with high Y variable scores (and vice versa).
2
a) significnce test between panel area(X1) and free burned (y)
r = 0.4021
n = 17
t test = r*square root of [(n-2)/( 1- r^2)]
t = 1.70 so, right tail P-Value is .054883.
The result is not significant at p < .05. so there is
no strong correlation between panel area and free burned
b)significnce test between #panel(X3) and free burned (y)
r = 0.6045
n= 17
t =2.93 right tail P-Value is .005173.
The result is significant at p < .05 means there is a strong
correlation between # panel and free burned
c) r = 0.7777 we can say that there is a strong correlation between floor area and free burned at 5 % significance because of same sample size and high r value.
3) between panel area and free burned- linear equation

linear equation : y= 0.0996*x +667.98
between floor area and free burned- linear equation

linear equation : y = 0.8838*x - 252.57
between# panel and free burned- linear equation
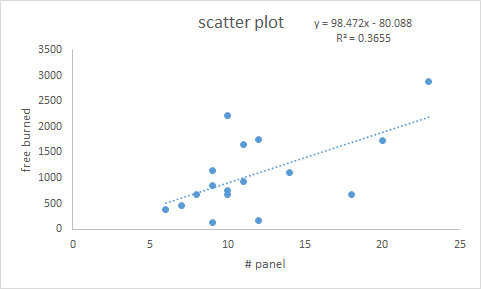
linear equation : y = 98472*x -80.088
4) after removal the outlier
| 14459-panel area | 1138- free burned |

y = 0.4256*x -383.86
5) between panel area and free burned after removal outlier
Y = -383.8617 + 0.4256 X1
| Source |
DF |
Sum of Squares | Mean Square | F Statistic | P-value |
|---|---|---|---|---|---|
| Regression (between ŷi andyi bar) |
1 |
5953159.9054 |
5953159.9054 |
26.8510 |
0.0001391 |
| Residual (between yi and ŷi) |
14 |
3103955.7000 |
221711.1214 |
||
| Total(between yi andyi bar) |
15 |
9057115.6054 |
603807.7070 |
|
Coeff |
SE | t-stat | lower t0.025(14) | upper t0.975(14) |
Stand Coeff |
p-value |
VIF |
|
|---|---|---|---|---|---|---|---|---|
| intercept | -383.8617 | 304.0027 | -1.2627 | -1035.8825 | 268.1592 | 0.000 | 0.2273 | |
| slope | 0.4256 | 0.08212 | 5.1818 | 0.2494 | 0.6017 | 0.8107 | 0.0001391 | 1.0000 |
Y and X
relationship
R square (R2) equals 0.6573. It means
that the predictors (Xi) explain 65.7% of the variance
of Y.
Adjusted R square equals 0.6328.
The coefficient of correlation (R) equals 0.8107.
It means that there is a very strong direct relationship between
the predicted data (ŷ) and the observed data (y).
Goodness of
fit
Overall regression: right-tailed, F(1,14) = 26.8510,
p-value = 0.0001391. Since p-value < α (0.05), we reject the
H0.
The linear regression model, Y = b0+
b1X1provides a better fit
All the independent variables (Xi) are significant.
The Y-intercept : two-tailed, T = -1.2627, p-value = 0.2273. Hence
intercept is not significantly different from zero. It is still
most likely recommended not to force b to be zero.
between floor area and free burned - there is no outlier
Y = -252.5679 + 0.8838 X1
| Source |
DF |
Sum of Squares | Mean Square | F Statistic | P-value |
|---|---|---|---|---|---|
| Regression (between ŷi andyi bar) |
1 |
5480818.3840 |
5480818.3840 |
22.9589 |
0.0002378 |
| Residual (between yi and ŷi) |
15 |
3580839.9055 |
238722.6604 |
||
| Total(between yi andyibar) |
16 |
9061658.2896 |
566353.6431 |
|
Coeff |
SE | t-stat | lower t0.025(15) | upper t0.975(15) |
Stand Coeff |
p-value |
VIF |
|
|---|---|---|---|---|---|---|---|---|
| intercept | -252.5679 | 300.8844 | -0.8394 | -893.8878 | 388.7521 | 0.000 | 0.4144 | |
| slope | 0.8838 | 0.1844 | 4.7915 | 0.4906 | 1.2769 | 0.7777 | 0.0002378 | 1.0000 |
Y and X
relationship
R square (R2) equals 0.6048. It means
that the predictors (Xi) explain 60.5% of the variance
of Y.
Adjusted R square equals 0.5785.
The coefficient of correlation (R) equals 0.7777.
It means that there is a strong direct relationship between the
predicted data (ŷ) and the observed data (y).
Goodness of
fit
Overall regression: right-tailed, F(1,15) = 22.9589,
p-value = 0.0002378. Since p-value < α (0.05), we reject the
H0.
The linear regression model, Y = b0+
b1X1 provides a better fit t
All the independent variables (Xi) are significant.
The Y-intercept : two-tailed, T = -0.8394, p-value = 0.4144. Hence
intercept is not significantly different from zero. It is still
most likely recommended not to force b to be zero.
between # panel and free burned - there is no outlier
y = -80.0880 + 98.4719 X1
| Source |
DF |
Sum of Squares | Mean Square | F Statistic | P-value |
|---|---|---|---|---|---|
| Regression (between ŷi andyibar) |
1 |
3311716.2806 |
3311716.2806 |
8.6393 |
0.01015 |
| Residual (between yi and ŷi) |
15 |
5749942.0089 |
383329.4673 |
||
| Total(between yi andyibar) |
16 |
9061658.2896 |
566353.6431 |
|
Coeff |
SE | t-stat | lower t0.025(15) | upper t0.975(15) |
Stand Coeff |
p-value |
VIF |
|
|---|---|---|---|---|---|---|---|---|
| intercept | -80.0880 | 419.9374 | -0.1907 | -975.1634 | 814.9873 | 0.000 | 0.8513 | |
| slope | 98.4719 | 33.5021 | 2.9393 | 27.0639 | 169.8800 | 0.6045 | 0.01015 | 1.0000 |
Y and X
relationship
R square (R2) equals 0.3655. It means
that the predictors (Xi) explain 36.5% of the variance
of Y.
Adjusted R square equals 0.3232.
The coefficient of correlation (R) equals 0.6045.
It means that there is a strong direct relationship between the
predicted data (ŷ) and the observed data (y).
Goodness of
fit
Overall regression: right-tailed, F(1,15) = 8.6393,
p-value = 0.01015. Since p-value < α (0.05), we reject the
H0.
The linear regression model, Y = b0+
b1X1, provides a better fit.
All the independent variables (Xi) are significant.
The Y-intercept : two-tailed, T = -0.1907, p-value = 0.8513. Hence
intercept is not significantly different from zero. It is still
most likely recommended not to force b to be zero.
so, the best model is panel area nad free burned relationship.
6)
with three explanatory variable
y = -740.43 + 0.0454749*X1 + 0.659653*X2 + 54.6017X3
| Variable | Parameter | S.D. | T-STAT H0: parameter = 0 |
2-tail p-value | 1-tail p-value |
| (Intercept) | -740.4 | 336.6 | -2.2000e+00 | 0.04651 | 0.02326 |
| X1 | +0.04548 | 0.03758 | +1.2100e+00 | 0.2478 | 0.1239 |
| X2 | +0.6596 | 0.1887 | +3.4960e+00 | 0.003946 | 0.001973 |
| X3 | +54.6 | 26.01 | +2.1000e+00 | 0.05586 | 0.02793 |
| Multiple Linear Regression - Regression Statistics | |
| Multiple R | 0.8532 |
| R-squared | 0.7279 |
| Adjusted R-squared | 0.6651 |
| F-TEST (value) | 11.59 |
| F-TEST (DF numerator) | 3 |
| F-TEST (DF denominator) | 13 |
| p-value | 0.0005619 |
| Multiple Linear Regression - Residual Statistics | |
| Residual Standard Deviation | 435.5 |
| Sum Squared Residuals | 2.465e+06 |
WITH two explanatory variable - floor area and # panel
y = -650.516 + 0.722435X2 + 54.6614V3X3
| Variable | Parameter | S.D. | T-STAT H0: parameter = 0 |
2-tail p-value | 1-tail p-value |
| (Intercept) | -650.5 | 333.7 | -1.9500e+00 | 0.07155 | 0.03578 |
| X2 | +0.7224 | 0.1844 | +3.9170e+00 | 0.001548 | 0.0007738 |
| X3 | +54.66 | 26.43 | +2.0680e+00 | 0.05766 | 0.02883 |
| Multiple Linear Regression - Regression Statistics | |
| Multiple R | 0.835 |
| R-squared | 0.6973 |
| Adjusted R-squared | 0.654 |
| F-TEST (value) | 16.12 |
| F-TEST (DF numerator) | 2 |
| F-TEST (DF denominator) | 14 |
| p-value | 0.0002329 |
| Multiple Linear Regression - Residual Statistics | |
| Residual Standard Deviation | 442.6 |
| Sum Squared Residuals | 2.743e+06 |
Based on F test and slope test of two models we can say that the second model is best ( two variable) because 69 % explained by this two variable if I include third variable help to explained extra 3 %.
7) y = -740.43 + 0.0454749*X1 + 0.659653*X2 + 54.6017X3
x1 =5000
x2= 2500
x3 =11
y = -740.43 + 0.0454749*5000 + 0.659653*2500 + 54.6017*11
y = 1736.6957
Add Answer to:
Eclipse Engineering provides services of structural engineering. They just opened a new branch in...
Eclipse Engineering provides services of structural engineering. They just opened a new branch in...
Eclipse Engineering provides services of structural engineering. They just opened a new branch in Portland, OR. One of their products is called Structural Insulated Panels, or SIPs. It is a type of foam insulation that replaces typical wall and roof framing for residential or commercial buildings. Clients are billed a fixed fee for each project based on square footage of the building, square footage of the panel area, and number of panels. Depending on how long a project takes to...
Styles The data in the accompanying table represent the population of a certain country every 10 ...
 Styles The data in the accompanying table represent the population of a certain country every 10 years for the years 1900-2000. An ecologist is interested in finding an equation that describes the population of the country over time. Complete parts (a) through (3) below Year, x 1900 1910 1920 1930 1940 1950 Population, y Year, x Population, y 179,323 203,302 79,212 1960 95,228 1970 104,021 1980 123,202 1990 132,164 2000 151,325 226,542 248,709 281,421 (a)Determine the least-squares regression equation, treating...
Please show all work AND any calculator functions. The table below summarizes data of heights and...
Please show all work AND any calculator functions. The table below summarizes data of heights and weights of 8 randomly selected adults. Use this information to answer parts a) – h). Height (x) in inches 5.2 5.6 5.8 5.9 5.4 6.1 6.0 5.7 Weight (y) in pounds 119 136 155 185 135 202 194 165 a) Test the claim ρ ≠ 0. Use α = 0.01. • State the hypotheses and label the claim. • State the significance level (α)....
Statistics
Y = listing priceX1 = interior floor space (square footage of the house)X2 = land size (square footage). This is usually represented by length of the front of the lot (in ft) X the depth of the lot (in ft). sizes range but a common lot size in Vancouver is 33 X 120. You will need to convert this to feet squared (area) before entering it into your spreadsheet (i.e., 3960)X3 = number of bedroomsX4 = number of bathroomsX5 =...
(1 point) College Graduation Rates. Data from the College Results Online website compared the 2011 graduation...
 (1 point) College Graduation Rates. Data from the College Results Online website compared the 2011 graduation rate and school size for 92 similar sized public universities and colleges in the United States. Statistical software was used to create the linear regression model using size as the explanatory variable and graduation rate as the response variable. Summary output from the software and the scatter plot are shown below. Round all calculated results to four decimal places Coefficients Estimate Std. Errort value...
7. A study was conducted to investigate the effectiveness of a new drug for treating Stage...
7. A study was conducted to investigate the effectiveness of a new drug for treating Stage 4 AIDS patients. A group of AIDS patients was randomly divided into two groups. One group received the new drug; the other group received a placebo. The difference in mean subsequent survival (those with drugs - those without drugs) was found to be 1.04 years and a 95% confidence interval was found to be 1.04 ± 2.37 years. Based upon this information: Select one...
1 point) College Graduation Rates. Data from the College Results Online website compared the 2011...
 Hi! Can someone help me to calculate the last question, the CI?
Thanks!
1 point) College Graduation Rates. Data from the College Results Online website compared the 2011 graduation rate and school sze for 92 similar-sized public universities and colleges in the United States. Statistical sottware was used to places. create the linear regression model using size as the explanatory variable and graduation rate as the response variable. Summary output from the software and the scatter plot are shown below....
Hi! Can someone help me to calculate the last question, the CI?
Thanks!
1 point) College Graduation Rates. Data from the College Results Online website compared the 2011 graduation rate and school sze for 92 similar-sized public universities and colleges in the United States. Statistical sottware was used to places. create the linear regression model using size as the explanatory variable and graduation rate as the response variable. Summary output from the software and the scatter plot are shown below....
u LLS FRUICHUISJ and 6 use the following information. Prehistoric pottery vessels are usually found as...
 u LLS FRUICHUISJ and 6 use the following information. Prehistoric pottery vessels are usually found as sherds (broken pieces) and are care- fully reconstructed if enough sherds can be found. Information taken from Mimbres Mogollon Archaeology by A. I. Woosley and A.J. McIntyre (University of New Mexico Press) provides data relating x = body diameter in centimeters and y = height in centimeters of prehistoric vessels reconstructed from sherds found at a prehistoric site. The following Minitab printout provides an...
**************ALL OF THE PARTS ARE FROM ONE QUESTION.**************** **********ALL OF THE PARTS ARE FROM ONE QUESTION.*********** (a) The mathematical ability of a random sample of 306 students were...
 **************ALL OF THE PARTS ARE FROM ONE
QUESTION.****************
**********ALL OF THE PARTS ARE FROM ONE
QUESTION.***********
(a) The mathematical ability of a random sample of 306 students were as- sessed by means of a test. The test regards the mathematical ability of the student as either: low, medium or high. The handedness of each subject (right-handed of left-handed) was also recorded. The data is pre- sented in the table below. Low MediumHigh Total Left-handed19 393391 1 215 74 306 114...
**************ALL OF THE PARTS ARE FROM ONE
QUESTION.****************
**********ALL OF THE PARTS ARE FROM ONE
QUESTION.***********
(a) The mathematical ability of a random sample of 306 students were as- sessed by means of a test. The test regards the mathematical ability of the student as either: low, medium or high. The handedness of each subject (right-handed of left-handed) was also recorded. The data is pre- sented in the table below. Low MediumHigh Total Left-handed19 393391 1 215 74 306 114...
The multiplication of two variables is used as a predictor if the two variables jointly affect...
 The multiplication of two variables is used as a predictor if the two variables jointly affect the response. True O False Question 7 1 pts Even if the P-value of the F test in a multiple regression model is nearly zero, it is possible that the R of the model is much less than one. OT False Question 8 1 pts in selecting independent variables for a regression model, neither the forward selection method nor the backward elimination method guarantee...
 Styles The data in the accompanying table represent the population of a certain country every 10 years for the years 1900-2000. An ecologist is interested in finding an equation that describes the population of the country over time. Complete parts (a) through (3) below Year, x 1900 1910 1920 1930 1940 1950 Population, y Year, x Population, y 179,323 203,302 79,212 1960 95,228 1970 104,021 1980 123,202 1990 132,164 2000 151,325 226,542 248,709 281,421 (a)Determine the least-squares regression equation, treating...
 (1 point) College Graduation Rates. Data from the College Results Online website compared the 2011 graduation rate and school size for 92 similar sized public universities and colleges in the United States. Statistical software was used to create the linear regression model using size as the explanatory variable and graduation rate as the response variable. Summary output from the software and the scatter plot are shown below. Round all calculated results to four decimal places Coefficients Estimate Std. Errort value...
 Hi! Can someone help me to calculate the last question, the CI?
Thanks!
1 point) College Graduation Rates. Data from the College Results Online website compared the 2011 graduation rate and school sze for 92 similar-sized public universities and colleges in the United States. Statistical sottware was used to places. create the linear regression model using size as the explanatory variable and graduation rate as the response variable. Summary output from the software and the scatter plot are shown below....
Hi! Can someone help me to calculate the last question, the CI?
Thanks!
1 point) College Graduation Rates. Data from the College Results Online website compared the 2011 graduation rate and school sze for 92 similar-sized public universities and colleges in the United States. Statistical sottware was used to places. create the linear regression model using size as the explanatory variable and graduation rate as the response variable. Summary output from the software and the scatter plot are shown below....
 u LLS FRUICHUISJ and 6 use the following information. Prehistoric pottery vessels are usually found as sherds (broken pieces) and are care- fully reconstructed if enough sherds can be found. Information taken from Mimbres Mogollon Archaeology by A. I. Woosley and A.J. McIntyre (University of New Mexico Press) provides data relating x = body diameter in centimeters and y = height in centimeters of prehistoric vessels reconstructed from sherds found at a prehistoric site. The following Minitab printout provides an...
 **************ALL OF THE PARTS ARE FROM ONE
QUESTION.****************
**********ALL OF THE PARTS ARE FROM ONE
QUESTION.***********
(a) The mathematical ability of a random sample of 306 students were as- sessed by means of a test. The test regards the mathematical ability of the student as either: low, medium or high. The handedness of each subject (right-handed of left-handed) was also recorded. The data is pre- sented in the table below. Low MediumHigh Total Left-handed19 393391 1 215 74 306 114...
**************ALL OF THE PARTS ARE FROM ONE
QUESTION.****************
**********ALL OF THE PARTS ARE FROM ONE
QUESTION.***********
(a) The mathematical ability of a random sample of 306 students were as- sessed by means of a test. The test regards the mathematical ability of the student as either: low, medium or high. The handedness of each subject (right-handed of left-handed) was also recorded. The data is pre- sented in the table below. Low MediumHigh Total Left-handed19 393391 1 215 74 306 114...
 The multiplication of two variables is used as a predictor if the two variables jointly affect the response. True O False Question 7 1 pts Even if the P-value of the F test in a multiple regression model is nearly zero, it is possible that the R of the model is much less than one. OT False Question 8 1 pts in selecting independent variables for a regression model, neither the forward selection method nor the backward elimination method guarantee...
Most questions answered within 3 hours.
-
IN PYTHON ONLY !! Program 2: Re-work
program #5 (WeeklyHours) from the previous assignment such that...
asked 29 minutes ago -
The average length of time between arrivals at a turnpike
toll-booth is 26 seconds. What is...
asked 2 hours ago -
(a) A piston at 6.1 atm contains a gas that occupies a volume of
3.5 L....
asked 3 hours ago -
Please answer true or false. Words
cannot be changed or added in to make it true...
asked 3 hours ago -
An empty test tube weighs 15.923 grams. Then,
MgCl2•6H2O is added into the test tube. After...
asked 3 hours ago -
Assume memory access is 10 units of time and disk access is
10000 units of time....
asked 3 hours ago -
1. Are all good samples random?
2. Magazines often report surveys giving statistics such as “63%...
asked 4 hours ago -
Under all the various types of market structures, firms
must eventually earn some economic profits for...
asked 3 hours ago -
Consider the following fitness regime for a single locus trait
with two co-dominant alleles: w11 =...
asked 3 hours ago -
A large cable company reports the following.
80% of its customers subscribe to its cable TV...
asked 4 hours ago -
Please answer the question in brief.
Discuss the role of ERP in organizations. Are ERP tools...
asked 3 hours ago -
Discuss the pros and cons of collaborative software such
as SameTime. Does it increase productivity? What...
asked 4 hours ago