**************ALL OF THE PARTS ARE FROM ONE
QUESTION.****************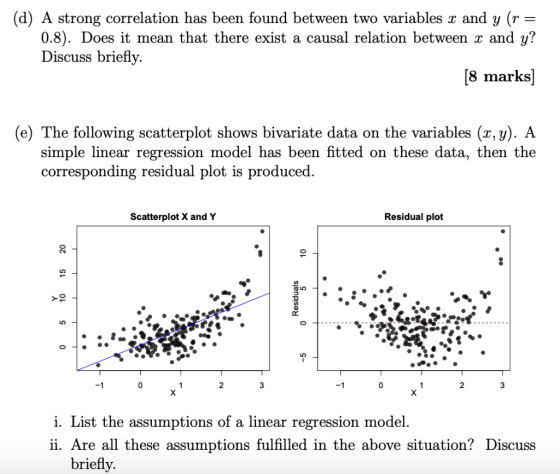
**********ALL OF THE PARTS ARE FROM ONE QUESTION.***********
(d) A strong correlation has been found between two variables x and y (r 0.8). Does it mean that there exist a causal relation between x and y? [8 marks] (e) The following scatterplot shows bivariate data on the variables (x, y). A scuss briefly simple linear regression model has been fitted on these data, then the corresponding residual plot is produced. Scatterplot X and Y Residual plot i. List the assumptions of a linear regression model ii. Are all these assumptions fulfilled in the above situation? Discuss briefly
Homework Answers
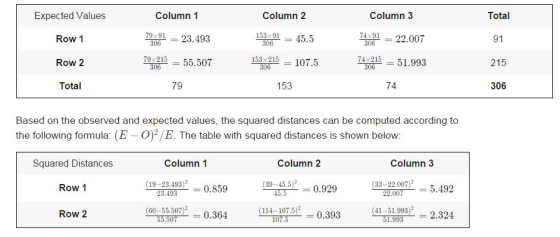
ii) Null and Alternative Hypotheses
The following null and alternative hypotheses need to be tested:
H0: The two variables are independent
Ha: The two variables are dependent
This corresponds to a Chi-Square test of independence.
Rejection Region
Based on the information provided, the significance level is α=0.05 , the number of degrees of freedom is df=(2−1)×(3−1)=2, so then the rejection region for this test is R={χ^2 :χ^2 >5.991}.
Decision about the null hypothesis
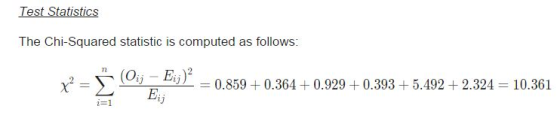
Since it is observed that χ^2=10.361>χc^2 =5.991, it is then concluded that the null hypothesis is rejected.
Conclusion
It is concluded that the null hypothesis Ho is rejected. Therefore, there is enough evidence to claim that there is association between two variables, at the 0.05 significance level.
b) i) Critical value for this test with df1= n1-1=8-1=7 and df2= n2-1=17-1=16 at alpha=0.01
F critical= 4.026
ii) Since F test statistic is greater than Fcritical therefore we DO NOT REJECT NULL HYPOTHESIS and may conclude that population variances are equal.
c) i) The P-Value is .047704.
The result is not significant because p > .01.
ii) Type 2 error
Fail to reject H0 when H1 is TRUE.
NOTE: I HAVE DONE THE FIRST FOUR PARTS OF THE QUESTION. PLEASE REPOST (d) and (e) Thank you.
Add Answer to:
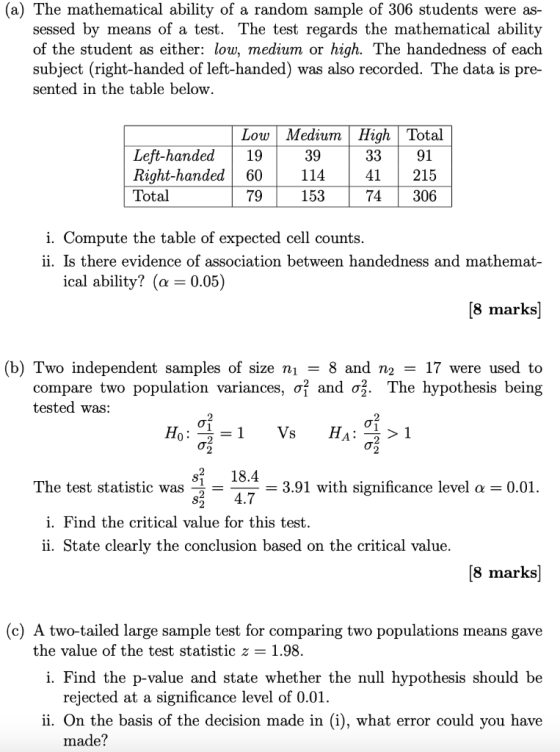
**************ALL OF THE PARTS ARE FROM ONE QUESTION.**************** **********ALL OF THE PARTS ARE FROM ONE QUESTION.*********** (a) The mathematical ability of a random sample of 306 students were...
PLEASE ANSWER ALL parts . IF YOU CANT ANSWER ALL, KINDLY ANSWER PART (E) AND PART(F)...
 PLEASE ANSWER ALL parts .
IF YOU CANT ANSWER ALL, KINDLY ANSWER PART (E) AND
PART(F)
FOR PART (E) THE REGRESSION MODEL IS ALSO GIVE AT THE
END.
REGRESSION MODEL:
We will be returning to the mtcars dataset, last seen in assignment 4. The dataset mtcars is built into R. It was extracted from the 1974 Motor Trend US magazine, and comcaprises fuel consumption and 10 aspects of automobile design and performance for 32 automobiles (1973-74 models). You can find...
PLEASE ANSWER ALL parts .
IF YOU CANT ANSWER ALL, KINDLY ANSWER PART (E) AND
PART(F)
FOR PART (E) THE REGRESSION MODEL IS ALSO GIVE AT THE
END.
REGRESSION MODEL:
We will be returning to the mtcars dataset, last seen in assignment 4. The dataset mtcars is built into R. It was extracted from the 1974 Motor Trend US magazine, and comcaprises fuel consumption and 10 aspects of automobile design and performance for 32 automobiles (1973-74 models). You can find...
Please answer all parts, use question #2 to solve #3. 2. For a random sample of...
 Please answer all parts, use question #2 to solve #3.
2. For a random sample of size n = 25, the correlation is r = 0.31 for normal random variables X and Y. Answer the questions for the hypothesis test. Use a level of significance of a = 0.08. Ho: p= 0 H1: p0 a. The critical value is Z = b. The test statistic is Z = C. The p-value is d. The hypothesis (should, should not) be rejected....
Please answer all parts, use question #2 to solve #3.
2. For a random sample of size n = 25, the correlation is r = 0.31 for normal random variables X and Y. Answer the questions for the hypothesis test. Use a level of significance of a = 0.08. Ho: p= 0 H1: p0 a. The critical value is Z = b. The test statistic is Z = C. The p-value is d. The hypothesis (should, should not) be rejected....
Question 312 marks An study was conducted using data from pedometers of 68 randomly selected part...
 Question 312 marks An study was conducted using data from pedometers of 68 randomly selected participants. The researchers wanted to know if the number of steps taken by a participant (Steps) could be predicted using the time they spent walking (Minutes). The data are available on MyUni in the file Steps.csv. 2 (a) Produce a scatterplot of Steps vs Minutes and describe any relationship between these two variables. (b) Perform a linear regression analysis on this data in MATLAB and...
Please show all work AND any calculator functions. The table below summarizes data of heights and...
Please show all work AND any calculator functions. The table below summarizes data of heights and weights of 8 randomly selected adults. Use this information to answer parts a) – h). Height (x) in inches 5.2 5.6 5.8 5.9 5.4 6.1 6.0 5.7 Weight (y) in pounds 119 136 155 185 135 202 194 165 a) Test the claim ρ ≠ 0. Use α = 0.01. • State the hypotheses and label the claim. • State the significance level (α)....
Question 1: (10 marks) Let Y, Y....,Y, be a random sample from the beta distribution with...
 Question 1: (10 marks) Let Y, Y....,Y, be a random sample from the beta distribution with a = B = 4, and I2 = { u u = 1,2). Write the likelihood ratio test statistic A for testing Ho : H = 1 versus H:u= 2. Note that the pdf of a beta(a,b) distribution is as follows: com_(a+b)/2-1(1 - 0)8-1, 0<I<1. f(x) = f(a)(B)"
3. [25 marks] Some female psychology students were investigating whether intelligence depends on brain size. They each t...
 3. [25 marks] Some female psychology students were investigating
whether intelligence depends on brain size. They each took a
standard test that measured verbal IQ and also underwent an MRI
scan to measure their brain size. The resulting data is below, file
named IQBrain.csv.
IQ
BrainV
132
816.932
132
951.545
90
928.799
136
991.305
90
854.258
129
833.868
120
856.472
100
878.897
71
865.363
132
852.244
112
808.02
129
790.619
86
831.772
90
798.612
83
793.549
126
866.662
126
857.782...
3. [25 marks] Some female psychology students were investigating
whether intelligence depends on brain size. They each took a
standard test that measured verbal IQ and also underwent an MRI
scan to measure their brain size. The resulting data is below, file
named IQBrain.csv.
IQ
BrainV
132
816.932
132
951.545
90
928.799
136
991.305
90
854.258
129
833.868
120
856.472
100
878.897
71
865.363
132
852.244
112
808.02
129
790.619
86
831.772
90
798.612
83
793.549
126
866.662
126
857.782...
The Excel file: DASSxlsx contains information recorded on a sample of 40 of the college students'...
 The Excel file: DASSxlsx contains information recorded on a sample of 40 of the college students' responses. The file contains the DASScore (representing level of mood) and the Arxiety Score for each student Download the data file and fit a linear regression model for predicting DASSScore (Y) from AnxietyScore (0) Use your Excel output, and any other information provided to answer the following questions. For each question, either choose the most correct option, or type in the answer to the...
A sample of 75 undergraduates were asked to participate in a study to investigate the relationship...
 A sample of 75 undergraduates were asked to participate in a study to investigate the relationship between a person's grip strength (in newtons) and their forearm circumference (in centimeters). The following plot shows a scatterplot of these data. 24 26 28 30 Forearm. Circumference What is the most correct interpretation of this plot? at is the most correct interpretation of this plot? OThere is a no clear relationship between grip strength and forearm circumference OThere is a weak negative relationship...
Answer ALL parts of this question. (a) Describe the design a...
Answer ALL parts of this question. (a) Describe the design and operation of glucose biosensors. (8 marks) (b) Discuss TWO of the following techniques. (i) Inductively Coupled Plasma – Mass Spectrometry (ICP-MS). (ii) Cold Vapour Generation Atomic Absorption Spectroscopy (CVAAS). (iii) Laser Ablation ICP-MS (2 x 4 marks) (c) The calibration data for the determination of lead levels in salmon by a new atomic absorption spectroscopy method are shown below. [Pb] / mgL-1 0 5 10 20 40 Absorption 0.000...
Two freshman algebra classes were studied, one of which used laptop computers at school and at home, while the other cla...
Two freshman algebra classes were studied, one of which used laptop computers at school and at home, while the other class did not. In each class, students were given a survey at the beginning and end of the semester, measuring his or her technological level. The scores were recorded for the end of semester survey (x) and the final examination (y) for the laptop group. The data and the MINITAB printout are shown here. Student Posttest Final Exam Student Posttest ...
 PLEASE ANSWER ALL parts .
IF YOU CANT ANSWER ALL, KINDLY ANSWER PART (E) AND
PART(F)
FOR PART (E) THE REGRESSION MODEL IS ALSO GIVE AT THE
END.
REGRESSION MODEL:
We will be returning to the mtcars dataset, last seen in assignment 4. The dataset mtcars is built into R. It was extracted from the 1974 Motor Trend US magazine, and comcaprises fuel consumption and 10 aspects of automobile design and performance for 32 automobiles (1973-74 models). You can find...
PLEASE ANSWER ALL parts .
IF YOU CANT ANSWER ALL, KINDLY ANSWER PART (E) AND
PART(F)
FOR PART (E) THE REGRESSION MODEL IS ALSO GIVE AT THE
END.
REGRESSION MODEL:
We will be returning to the mtcars dataset, last seen in assignment 4. The dataset mtcars is built into R. It was extracted from the 1974 Motor Trend US magazine, and comcaprises fuel consumption and 10 aspects of automobile design and performance for 32 automobiles (1973-74 models). You can find...
 Please answer all parts, use question #2 to solve #3.
2. For a random sample of size n = 25, the correlation is r = 0.31 for normal random variables X and Y. Answer the questions for the hypothesis test. Use a level of significance of a = 0.08. Ho: p= 0 H1: p0 a. The critical value is Z = b. The test statistic is Z = C. The p-value is d. The hypothesis (should, should not) be rejected....
Please answer all parts, use question #2 to solve #3.
2. For a random sample of size n = 25, the correlation is r = 0.31 for normal random variables X and Y. Answer the questions for the hypothesis test. Use a level of significance of a = 0.08. Ho: p= 0 H1: p0 a. The critical value is Z = b. The test statistic is Z = C. The p-value is d. The hypothesis (should, should not) be rejected....
 Question 312 marks An study was conducted using data from pedometers of 68 randomly selected participants. The researchers wanted to know if the number of steps taken by a participant (Steps) could be predicted using the time they spent walking (Minutes). The data are available on MyUni in the file Steps.csv. 2 (a) Produce a scatterplot of Steps vs Minutes and describe any relationship between these two variables. (b) Perform a linear regression analysis on this data in MATLAB and...
 Question 1: (10 marks) Let Y, Y....,Y, be a random sample from the beta distribution with a = B = 4, and I2 = { u u = 1,2). Write the likelihood ratio test statistic A for testing Ho : H = 1 versus H:u= 2. Note that the pdf of a beta(a,b) distribution is as follows: com_(a+b)/2-1(1 - 0)8-1, 0<I<1. f(x) = f(a)(B)"
 3. [25 marks] Some female psychology students were investigating
whether intelligence depends on brain size. They each took a
standard test that measured verbal IQ and also underwent an MRI
scan to measure their brain size. The resulting data is below, file
named IQBrain.csv.
IQ
BrainV
132
816.932
132
951.545
90
928.799
136
991.305
90
854.258
129
833.868
120
856.472
100
878.897
71
865.363
132
852.244
112
808.02
129
790.619
86
831.772
90
798.612
83
793.549
126
866.662
126
857.782...
3. [25 marks] Some female psychology students were investigating
whether intelligence depends on brain size. They each took a
standard test that measured verbal IQ and also underwent an MRI
scan to measure their brain size. The resulting data is below, file
named IQBrain.csv.
IQ
BrainV
132
816.932
132
951.545
90
928.799
136
991.305
90
854.258
129
833.868
120
856.472
100
878.897
71
865.363
132
852.244
112
808.02
129
790.619
86
831.772
90
798.612
83
793.549
126
866.662
126
857.782...
 The Excel file: DASSxlsx contains information recorded on a sample of 40 of the college students' responses. The file contains the DASScore (representing level of mood) and the Arxiety Score for each student Download the data file and fit a linear regression model for predicting DASSScore (Y) from AnxietyScore (0) Use your Excel output, and any other information provided to answer the following questions. For each question, either choose the most correct option, or type in the answer to the...
 A sample of 75 undergraduates were asked to participate in a study to investigate the relationship between a person's grip strength (in newtons) and their forearm circumference (in centimeters). The following plot shows a scatterplot of these data. 24 26 28 30 Forearm. Circumference What is the most correct interpretation of this plot? at is the most correct interpretation of this plot? OThere is a no clear relationship between grip strength and forearm circumference OThere is a weak negative relationship...
Most questions answered within 3 hours.
-
At the start of a CD it is spinning at a rate of 525 rpm
(revolutions...
asked 20 minutes ago -
4. Without doing any calculations, predict whether the observed
∆T would increase, decrease or remain the...
asked 1 hour ago -
Based on the range, which of the following sets of scores has
the greatest variability? 3,...
asked 2 hours ago -
Ripples in a pond travel at a velocity of 3 m/s with one peak
passing a...
asked 2 hours ago -
A man stands on the roof of a building of height 13.0 mm and
throws a...
asked 2 hours ago -
The extent to which assets are financed by borrowed funds and
other liabilities is indicated by:...
asked 3 hours ago -
Explain in detail
Germany is the fifth largest economy
explain what goods and services Germany specializes...
asked 3 hours ago -
The density of platinum is 21.45 g/mL. If a cube of platinum
with a mass of...
asked 4 hours ago -
Accounts Receivable
Sales
A/R Posting
Extended Sales Invoice
Packing Slip
Compare invoice to packing slip 2...
asked 4 hours ago -
Michaella, age 23, is a full-time law student and is claimed by
her parents as a...
asked 4 hours ago -
Why are polymers not typically casted into products?
asked 4 hours ago -
When rolling a die 129 times, what is the probability of rolling
a 6 no more...
asked 4 hours ago