
Homework Answers
 show ur answer
Add Answer to:
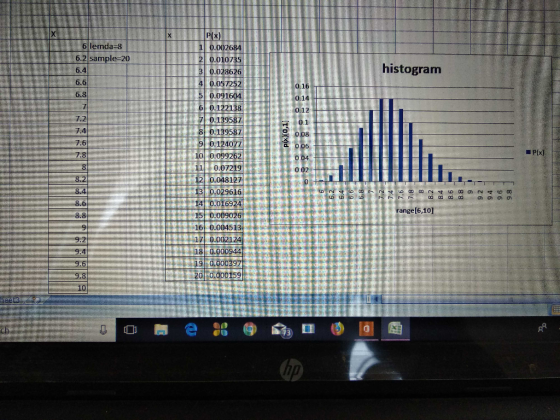
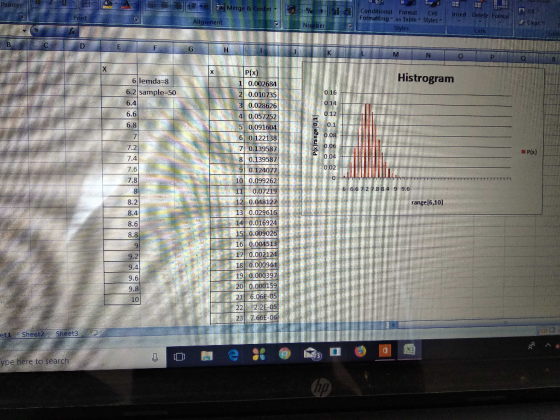
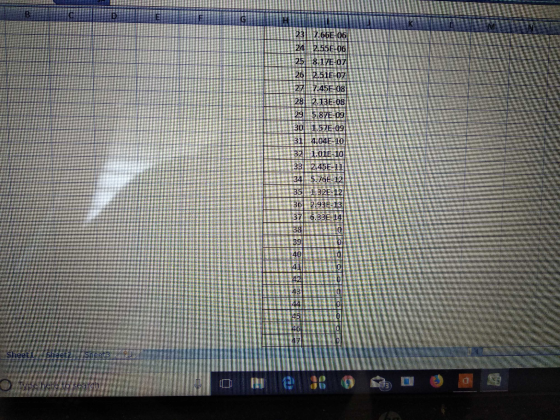
Robiem l. Sample imean ol Foisson distribution Draw 20 sainples irom a loisson distribution with ...
mathematical statistic 5.4.11 Generate a sample of 1000 from an N (3, 2) distribution. (a) Calculate...
 mathematical statistic
5.4.11 Generate a sample of 1000 from an N (3, 2) distribution. (a) Calculate Fx for this sample. 280 Section 5.4: Data Collection (b) Plot a density histogram based on these data using the intervals of length 1 over the range (-5, 10). (c) Plot a density histogram based on these data using the intervals of length 0.1 over the range (-5,10) d) Comment on the difference in the look of the histograms in parts (b) and (c)....
mathematical statistic
5.4.11 Generate a sample of 1000 from an N (3, 2) distribution. (a) Calculate Fx for this sample. 280 Section 5.4: Data Collection (b) Plot a density histogram based on these data using the intervals of length 1 over the range (-5, 10). (c) Plot a density histogram based on these data using the intervals of length 0.1 over the range (-5,10) d) Comment on the difference in the look of the histograms in parts (b) and (c)....
Please use html format! II. The goal of this problem is to simulate the distribution of the sample mean. We will...
 Please use html format!
II. The goal of this problem is to simulate the distribution of the sample mean. We will use the buit load the dataset and avoid some problems, copy and paste the following command in dataset 1ynx. To lynx as.numeric(lynx) Assume this vector represents the population. Le, the mean of this vector is our "true mean" (a) Draw a histogram of the population, find the "true" mean, and the true" variance. Does this data look normally distributed?...
Please use html format!
II. The goal of this problem is to simulate the distribution of the sample mean. We will use the buit load the dataset and avoid some problems, copy and paste the following command in dataset 1ynx. To lynx as.numeric(lynx) Assume this vector represents the population. Le, the mean of this vector is our "true mean" (a) Draw a histogram of the population, find the "true" mean, and the true" variance. Does this data look normally distributed?...
Instructions First, download real estate data from the city of Ames, Iowa: download.file("htt...
Instructions First, download real estate data from the city of Ames, Iowa: download.file("http://www.openintro.org/stat/data/ames.RData", destfile = "ames.RData") load("ames.RData") Now write code in R to answer the following questions. Make sure the script that you turn in includes the code that you write, the output that you get from that code (in a comment), and a sentence or more answering the question if there was one (also in a comment). Consider the variable Gr.Liv.Area of the ames data frame, which represents the...
R1. Suppose X is a continuous RV with E(X-μ and Var(X-σ2 where both μ and σ...
 R1. Suppose X is a continuous RV with E(X-μ and Var(X-σ2 where both μ and σ are unknown. Note that X may not be a normal distribution. Show that X is an asymptotically unbiased estimator for μ2. (This problem does not require the computer.) R2. Let X ~ N(μ 10.82). Following up on R1, we will be approximating μ2, which we can see should be 100, For now, let the sample size be n 3. Pick 3 random numbers from...
R2 IS THE QUESTION,THANKS! R2. Let X ~ N(μ = 10.82). Following upon we be approximating...
 R2 IS THE QUESTION,THANKS!
R2. Let X ~ N(μ = 10.82). Following upon we be approximating μwe can see should be 100. For now, let the sample size be n = 3, Pick 3 random numbers from X, compute X', and repeat the process a total of 50000 times. Plot a smooth version of the histogram of these 50000 values for X: the plot(density(...)) command in R will be useful. Now find the average of your 50000 values and make...
R2 IS THE QUESTION,THANKS!
R2. Let X ~ N(μ = 10.82). Following upon we be approximating μwe can see should be 100. For now, let the sample size be n = 3, Pick 3 random numbers from X, compute X', and repeat the process a total of 50000 times. Plot a smooth version of the histogram of these 50000 values for X: the plot(density(...)) command in R will be useful. Now find the average of your 50000 values and make...
RI. Suppose X is a continuous RV with E(X)-μ and Var(X)-σ2 where both μ and σ...
 RI. Suppose X is a continuous RV with E(X)-μ and Var(X)-σ2 where both μ and σ are unknown. Note that X may not be a normal distribution. Show that X is an asymptotically unbiased estimator for μ. (This problem does not require the computer.) R2. Let X ~ ŅĢi-10.82). Following up on RI, we will be approximating μ2, which we can see should be 100. For now, let the sample size be n = 3, Pick 3 random numbers from...
Python 3.7 please help please use central limit theory In this problem you will verify the...
 Python 3.7 please help
please use central limit theory
In this problem you will verify the Central Limit Theorem (CLT) which states that averages, from repeated random samples of any distribution, follow a normal distribution 1. (5 points) Draw a random sample of 5,000 random numbers from a uniform distribution X ~U (20,80] and store them into a vector called xy and plot a histogram of these 5,000 numbers 2. (5 points) Draw a random sample of 5,000 random numbers...
Python 3.7 please help
please use central limit theory
In this problem you will verify the Central Limit Theorem (CLT) which states that averages, from repeated random samples of any distribution, follow a normal distribution 1. (5 points) Draw a random sample of 5,000 random numbers from a uniform distribution X ~U (20,80] and store them into a vector called xy and plot a histogram of these 5,000 numbers 2. (5 points) Draw a random sample of 5,000 random numbers...
Name: Continuous Random Variables: Continuous Distribution Lab Collect the Data: Use a random num...
 Name: Continuous Random Variables: Continuous Distribution Lab Collect the Data: Use a random number generator to generate 50 values between 0 and 1 (inclusive). List them below. Round the numbers to 4 decimal places or set the calculator MODE to 4 places. Complete the table Calculate the following: 1t quartile Organize the Data Construct a histogram of the empirical data. 3rd quartile median Construct a histogram of the empirical data. Make 8 bars. Make 5 bars. Relative Frequency Relative Frequency...
Please answer this question with RStudio. 4. In this problem, you will illustrate the idea of...
 Please answer this question with RStudio.
4. In this problem, you will illustrate the idea of resampling and sampling distributions. A ganma distribution with shape k and scale θ has density exp(-v/0) Assume shape k = 2 and scale θ = 3 (a) Use the function dgamma in R to evaluate the density for a range of values between 0 and 20. Produce a plot of the density (b) The (true) mean and variance of the gamma distribution are simple...
Please answer this question with RStudio.
4. In this problem, you will illustrate the idea of resampling and sampling distributions. A ganma distribution with shape k and scale θ has density exp(-v/0) Assume shape k = 2 and scale θ = 3 (a) Use the function dgamma in R to evaluate the density for a range of values between 0 and 20. Produce a plot of the density (b) The (true) mean and variance of the gamma distribution are simple...
(b) Construct a frequency distribution showing the class limits for the four classes (c) Construct a...
 (b) Construct a frequency distribution showing the class limits for the four classes (c) Construct a bar-chart. 13/ The following gave the sample data on caffeine per ounce for 6 top-energy drinks 10, 10, 9, 11, 15, 8 a/Compute the mean b/Compute sample standard deviation. c/Find 5 number summary 14/Calculate the range, mean, median, first and third quartiles, mode for the following datasets: 47, 59, 50, 56, 56, 51, 52, 53 15/Find the mean, the range, 5 number summary and...
 mathematical statistic
5.4.11 Generate a sample of 1000 from an N (3, 2) distribution. (a) Calculate Fx for this sample. 280 Section 5.4: Data Collection (b) Plot a density histogram based on these data using the intervals of length 1 over the range (-5, 10). (c) Plot a density histogram based on these data using the intervals of length 0.1 over the range (-5,10) d) Comment on the difference in the look of the histograms in parts (b) and (c)....
mathematical statistic
5.4.11 Generate a sample of 1000 from an N (3, 2) distribution. (a) Calculate Fx for this sample. 280 Section 5.4: Data Collection (b) Plot a density histogram based on these data using the intervals of length 1 over the range (-5, 10). (c) Plot a density histogram based on these data using the intervals of length 0.1 over the range (-5,10) d) Comment on the difference in the look of the histograms in parts (b) and (c)....
 Please use html format!
II. The goal of this problem is to simulate the distribution of the sample mean. We will use the buit load the dataset and avoid some problems, copy and paste the following command in dataset 1ynx. To lynx as.numeric(lynx) Assume this vector represents the population. Le, the mean of this vector is our "true mean" (a) Draw a histogram of the population, find the "true" mean, and the true" variance. Does this data look normally distributed?...
Please use html format!
II. The goal of this problem is to simulate the distribution of the sample mean. We will use the buit load the dataset and avoid some problems, copy and paste the following command in dataset 1ynx. To lynx as.numeric(lynx) Assume this vector represents the population. Le, the mean of this vector is our "true mean" (a) Draw a histogram of the population, find the "true" mean, and the true" variance. Does this data look normally distributed?...
 R1. Suppose X is a continuous RV with E(X-μ and Var(X-σ2 where both μ and σ are unknown. Note that X may not be a normal distribution. Show that X is an asymptotically unbiased estimator for μ2. (This problem does not require the computer.) R2. Let X ~ N(μ 10.82). Following up on R1, we will be approximating μ2, which we can see should be 100, For now, let the sample size be n 3. Pick 3 random numbers from...
 R2 IS THE QUESTION,THANKS!
R2. Let X ~ N(μ = 10.82). Following upon we be approximating μwe can see should be 100. For now, let the sample size be n = 3, Pick 3 random numbers from X, compute X', and repeat the process a total of 50000 times. Plot a smooth version of the histogram of these 50000 values for X: the plot(density(...)) command in R will be useful. Now find the average of your 50000 values and make...
R2 IS THE QUESTION,THANKS!
R2. Let X ~ N(μ = 10.82). Following upon we be approximating μwe can see should be 100. For now, let the sample size be n = 3, Pick 3 random numbers from X, compute X', and repeat the process a total of 50000 times. Plot a smooth version of the histogram of these 50000 values for X: the plot(density(...)) command in R will be useful. Now find the average of your 50000 values and make...
 RI. Suppose X is a continuous RV with E(X)-μ and Var(X)-σ2 where both μ and σ are unknown. Note that X may not be a normal distribution. Show that X is an asymptotically unbiased estimator for μ. (This problem does not require the computer.) R2. Let X ~ ŅĢi-10.82). Following up on RI, we will be approximating μ2, which we can see should be 100. For now, let the sample size be n = 3, Pick 3 random numbers from...
 Python 3.7 please help
please use central limit theory
In this problem you will verify the Central Limit Theorem (CLT) which states that averages, from repeated random samples of any distribution, follow a normal distribution 1. (5 points) Draw a random sample of 5,000 random numbers from a uniform distribution X ~U (20,80] and store them into a vector called xy and plot a histogram of these 5,000 numbers 2. (5 points) Draw a random sample of 5,000 random numbers...
Python 3.7 please help
please use central limit theory
In this problem you will verify the Central Limit Theorem (CLT) which states that averages, from repeated random samples of any distribution, follow a normal distribution 1. (5 points) Draw a random sample of 5,000 random numbers from a uniform distribution X ~U (20,80] and store them into a vector called xy and plot a histogram of these 5,000 numbers 2. (5 points) Draw a random sample of 5,000 random numbers...
 Name: Continuous Random Variables: Continuous Distribution Lab Collect the Data: Use a random number generator to generate 50 values between 0 and 1 (inclusive). List them below. Round the numbers to 4 decimal places or set the calculator MODE to 4 places. Complete the table Calculate the following: 1t quartile Organize the Data Construct a histogram of the empirical data. 3rd quartile median Construct a histogram of the empirical data. Make 8 bars. Make 5 bars. Relative Frequency Relative Frequency...
 Please answer this question with RStudio.
4. In this problem, you will illustrate the idea of resampling and sampling distributions. A ganma distribution with shape k and scale θ has density exp(-v/0) Assume shape k = 2 and scale θ = 3 (a) Use the function dgamma in R to evaluate the density for a range of values between 0 and 20. Produce a plot of the density (b) The (true) mean and variance of the gamma distribution are simple...
Please answer this question with RStudio.
4. In this problem, you will illustrate the idea of resampling and sampling distributions. A ganma distribution with shape k and scale θ has density exp(-v/0) Assume shape k = 2 and scale θ = 3 (a) Use the function dgamma in R to evaluate the density for a range of values between 0 and 20. Produce a plot of the density (b) The (true) mean and variance of the gamma distribution are simple...
 (b) Construct a frequency distribution showing the class limits for the four classes (c) Construct a bar-chart. 13/ The following gave the sample data on caffeine per ounce for 6 top-energy drinks 10, 10, 9, 11, 15, 8 a/Compute the mean b/Compute sample standard deviation. c/Find 5 number summary 14/Calculate the range, mean, median, first and third quartiles, mode for the following datasets: 47, 59, 50, 56, 56, 51, 52, 53 15/Find the mean, the range, 5 number summary and...
Most questions answered within 3 hours.
-
Calculate the pH of a 5.7 M solution of aniline (C6H5NH2; Kb =
3.8 x 10^-10)
asked 28 minutes ago -
LSL R3, R3, R12
Memory
Address
Orig.
Data
Updated
Data
Register
Orig.
Data
Updated
Data
0x84F0...
asked 30 minutes ago -
Air at 100 kPa and density of 1.2 kg/m3 flows upward through a
5-cm diameter inclined...
asked 38 minutes ago -
Define the following concepts in your own words: (a) stiffness,
(b) strength, (c) strain,
(d) ductility,...
asked 1 hour ago -
In C++
In this homework, you will be tasked with creating functions to
manipulate strings that...
asked 1 hour ago -
An isolated colony represents a pure culture. one rare occasions
, however , a colony can...
asked 2 hours ago -
*****DO NOT ANSWER THIS QUESTION IF YOU DON'T
KNOW*******Rights and Duties of Auditors; Minimum 4000
words...
asked 3 hours ago -
The probability that Janie is wearing sunglasses is 1/4. The
probability that she is wearing sunglasses...
asked 3 hours ago -
Do you believe social media is more of a help or a hindrance in
controlling crises...
asked 3 hours ago -
Two long, parallel wires separated by 2.85 cm carry currents in
opposite directions. The current in...
asked 3 hours ago -
Question # 1. Develop a list of rehabilitation journals
that publish articles concerning career counseling for...
asked 3 hours ago -
Bryant Company has a factory machine with a book value of
$85,100 and a remaining useful...
asked 3 hours ago