

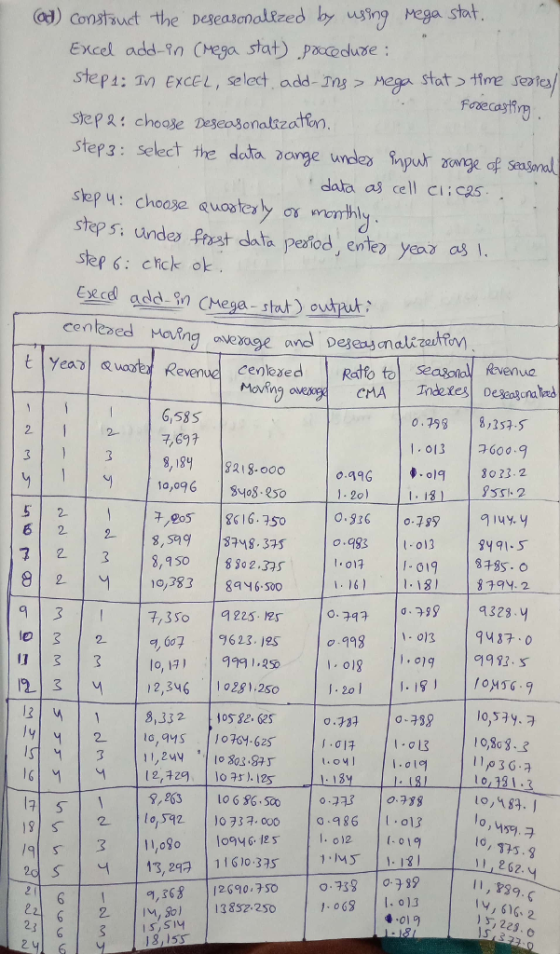
Data Extra Sheet Quarterly PepsiCo Revenues (millions), 2005-2010 Year Quarter Revenue 2005 In row-column format Qtr1 Qtr2 Qtr3 Qtr4 Qtr1 6,585 7,697 8,184 10,096 7.205 8.599 8,950 10,383 7.350 Quarter 2005 2007 7,350 9,607 10,945 10,592 14,801 2008 8,333 2010 Qtr1 6,585 7,697 8,184 8,950 10,171 11,244 11,080 15514 10,096 10.38312.346 12.729 13.297 18,155 7,205 8.263 Qtr3 2006 Data are from Standard & Poor's Stock Reports, March, 2007,http:/finance yahoo.com and httn /hwsu mernaninnlina.com Qtr4 Qtr1 Qtr2 2007 LearningStats 10,171 12,346 8,333 10,945 11,244 12,729 8,263 10,592 11,080 13,297 9.368 14,801 Copyright 0 2013 by The McGraw-Hit Companies 2008 This spreadsheet is intended solely for educational purposes by licersed usersof LeamingStors. It may not be copled orresols tor profit 2009 Qtr1 2010 Qt315,514 Qtr4 18,155
Homework Answers

b)

Regression using seasonal binaries:

c)
Predicted Value for 2011

Add Answer to:
2005 2006 2007 2008 2009 2010 6,5es 7,205 7.30 8,333 8.263 9,368 7,697 8,599 9,607 10,945 10.592 ...
Coca-Cola Revenues ($ millions), 2005-2010 Quarter 2005 2006 2007 2008 Qtri 5,196 5,109 6,065 7,360 Qtr2...
 Coca-Cola Revenues ($ millions), 2005-2010 Quarter 2005 2006 2007 2008 Qtri 5,196 5,109 6,065 7,360 Qtr2 6,300 6,455 7,695 9,035 Qtr3 6,027 6,402 7,652 8,299 Otr4 5,541 5,895 7,293 7,015 2009 2010 7,130 7,700 8,212 8,655 8,015 8,407 7,468 10,475 Click here for the Excel Data File (2-1) Use MegaStat or Minitab to deseasonalize Coca-Cola's quarterly data. (Round your answers to 3 decimal places.) 2 3 2005 2006 2007 2008 2009 2010 mean (a-2) State the adjusted four quarterly indexes....
DATA ANALYTICS
Item 9Item 9 2 pointsCoca-Cola Revenues ($ millions), 2005–2010Quarter200520062007200820092010Qtr15,2045,1266,0857,4007,1708,000Qtr26,3086,4757,7159,0558,2288,663Qtr36,0356,4187,6728,3118,0358,415Qtr45,5495,9157,3137,0807,49210,483 Click here for the Excel Data File (a-1) Use MegaStat or Minitab to deseasonalize Coca-Cola’s quarterly data. (Round your answers to 3 decimal places.) 1234200520062007200820092010mean (a-2) State the adjusted four quarterly indexes. (Round your answers to 3 decimal places.) Q1Q2Q3Q4 (a-3) What is the trend model for the deseasonalized time series? (Round your answers to 2 decimal places.) yt = xt + (b) State the model found when performing a regression using seasonal binaries. (A negative value should be indicated by a minus sign. Round your answers to 4 decimal places.) yt = + t + Q1...
Pro Forma Income Statement for Ideko, 2005-2010 2009 Year 2005 2006 2007 2008 2010 Income Statement...
 Pro Forma Income Statement for Ideko, 2005-2010 2009 Year 2005 2006 2007 2008 2010 Income Statement (000) 1 Sales 75,000 119,777 138,149 158,526 103,234 88,358 2 Cost of Goods Sold (16,000) (18,665) (21,593) (18,000) (21,622) (25,757) (24,808) (28,333) (32,193) (30,471) (35,834) (41,925) 84.407 3 Raw Materials 4 Direct Labor Costs 41,000 48,071 55,883 64,498 73.982 5 Gross Profit 6 Sales and Marketing 7 Administrative (11,250) (14,579) (13,500) (13,254) 16.250 20,238 (18,582) (31,705) (20,608) (23,356) (27,630) (16,769) (17,959) 24,373 28,393 (15.485)...
QUESTION 2 Use scratch paper as needed. Be sure to label the answer if it is on the paper. (Turn in the answers to the...
 QUESTION 2 Use scratch paper as needed. Be sure to label the answer if it is on the paper. (Turn in the answers to the proctor to be mailed to the instructor.) 02. (10 POINTS) Calculate the seasonal index for the following data, and forecast sales for each quarter in 2013, if sales for the ar 2013 is forecasted to be 3000 wwwwwww ww www w SHOW ALL CALCULATIONS Year Qtrl Qtr2 Qtr3 Qtr4 2007 400 420 430 500 2008...
Sales data of: 2006 - 17,000 2007 - 17,500 2008 - 18,200 2009 - 19,000 2010...
Sales data of: 2006 - 17,000 2007 - 17,500 2008 - 18,200 2009 - 19,000 2010 - 19,500 2011 - 20,100 2012 - 20,500 2013 - 21,000 Show Exponential Smoothing of the data with a smoothing constant of 45%
The following table Year A Returns B Returns 2005 -4.7% 17.7% 2006 1.4% -8.1% 2007 -31.4% ...
The following table Year A Returns B Returns 2005 -4.7% 17.7% 2006 1.4% -8.1% 2007 -31.4% -25.4% 2008 -11.3% -3.6% 2009 31.4% 10.4% 2010 26.7% 9.2% 2011 22.6% 5.4% 2012 51.5% 42.6% 2013 35.7% 41.5% 2014 29.3% 39.4% 2015 26.2% 12.1% 2016 5.5% -0.2% 2017 43.3% 26.2% contains annual returns for the stocks of Company Upper A (Upper A) and Company Upper B (Upper B). The returns are calculated using end-of-year prices (adjusted for dividends and stock splits). Use the...
 Coca-Cola Revenues ($ millions), 2005-2010 Quarter 2005 2006 2007 2008 Qtri 5,196 5,109 6,065 7,360 Qtr2 6,300 6,455 7,695 9,035 Qtr3 6,027 6,402 7,652 8,299 Otr4 5,541 5,895 7,293 7,015 2009 2010 7,130 7,700 8,212 8,655 8,015 8,407 7,468 10,475 Click here for the Excel Data File (2-1) Use MegaStat or Minitab to deseasonalize Coca-Cola's quarterly data. (Round your answers to 3 decimal places.) 2 3 2005 2006 2007 2008 2009 2010 mean (a-2) State the adjusted four quarterly indexes....
 Pro Forma Income Statement for Ideko, 2005-2010 2009 Year 2005 2006 2007 2008 2010 Income Statement (000) 1 Sales 75,000 119,777 138,149 158,526 103,234 88,358 2 Cost of Goods Sold (16,000) (18,665) (21,593) (18,000) (21,622) (25,757) (24,808) (28,333) (32,193) (30,471) (35,834) (41,925) 84.407 3 Raw Materials 4 Direct Labor Costs 41,000 48,071 55,883 64,498 73.982 5 Gross Profit 6 Sales and Marketing 7 Administrative (11,250) (14,579) (13,500) (13,254) 16.250 20,238 (18,582) (31,705) (20,608) (23,356) (27,630) (16,769) (17,959) 24,373 28,393 (15.485)...
 QUESTION 2 Use scratch paper as needed. Be sure to label the answer if it is on the paper. (Turn in the answers to the proctor to be mailed to the instructor.) 02. (10 POINTS) Calculate the seasonal index for the following data, and forecast sales for each quarter in 2013, if sales for the ar 2013 is forecasted to be 3000 wwwwwww ww www w SHOW ALL CALCULATIONS Year Qtrl Qtr2 Qtr3 Qtr4 2007 400 420 430 500 2008...
Most questions answered within 3 hours.
-
You are __________ to commit a Type I error using the 0.05 level
of significance than...
asked 10 minutes ago -
1. the following results are obtained:
200
kiwi
575 wild-type
What can we conclude about the...
asked 14 minutes ago -
Explain how you might use E. coli bacteria to produce human
growth hormone using the following:...
asked 15 minutes ago -
WHAT IS THE EFFEKT OF ADD K2CO3 TO ( METHANOL OG WATER)?
asked 30 minutes ago -
Calculate the cell potential, the equilibrium constant, and the
free-energy change for: Ca(s)+Mn2+(aq)(1M)⇌Ca2+(aq)(1M)+Mn(s) given
the following...
asked 27 minutes ago -
Determine the pH at the equivalence (stoichiometric) point in
the titration of 48 mL of 0.28...
asked 27 minutes ago -
11. In CPM/PERT, an activity that is on the critical path
A. has equal values for...
asked 34 minutes ago -
Using C++ :
A Pascals triangle row is constructed by looking at the previous
row and...
asked 51 minutes ago -
With what speed will the fastest photoelectrons be emitted from
a surface whose threshold wavelength is...
asked 51 minutes ago -
The following slope distances and differences in elevations
between the tape ends were recorded for a...
asked 52 minutes ago -
1. Assuming random walk markets and normally distributed
returns, if a one day VaR on an...
asked 1 hour ago -
(a) With a variable life insurance policy, the rate of return on
the investment (the death...
asked 1 hour ago