
Homework Answers
 The company has very good
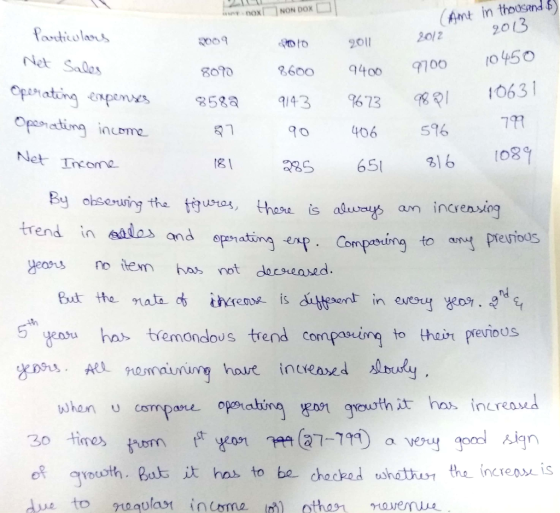
growth which can seen by increasing figures. If they try to reduce
the operating expenses they can achieve much more higher
percentage. That can only be done through long term contracts with
suppliers to get at lower prices and strategical planning for
procurement.
The company has very good
growth which can seen by increasing figures. If they try to reduce
the operating expenses they can achieve much more higher
percentage. That can only be done through long term contracts with
suppliers to get at lower prices and strategical planning for
procurement.
Add Answer to:
Calculate 5 year net sales, operating expenses, operating income, and net income and interpret th...
Calculate total profit margin, asset turnover, return on assests and return on net worth for jira...
 calculate total profit margin, asset turnover, return on assests
and return on net worth for jiranna healthcare. interpret the data
Jiranna Healthcare Cash Flows, 2013 (in thousands) Cash Flows from Operating Activities Cash received from patient and third-party payers Cash received from operating revenue sources Cash received from nonoperating revenue sources Cash payments to employees Cash payments to suppliers of goods and services $ 10,671 800 270 (5,600) (4,800) Net cash flow from operating activities $1,341 Cash flows from Investing...
calculate total profit margin, asset turnover, return on assests
and return on net worth for jiranna healthcare. interpret the data
Jiranna Healthcare Cash Flows, 2013 (in thousands) Cash Flows from Operating Activities Cash received from patient and third-party payers Cash received from operating revenue sources Cash received from nonoperating revenue sources Cash payments to employees Cash payments to suppliers of goods and services $ 10,671 800 270 (5,600) (4,800) Net cash flow from operating activities $1,341 Cash flows from Investing...
GAAP/Tax Income Statement For Year Ended December 31, 2011 Revenue 810,524 Operating Expenses 647,578 Net Income...
 GAAP/Tax Income Statement For Year Ended December 31, 2011 Revenue 810,524 Operating Expenses 647,578 Net Income 162,946 The following fixed assets were purchased during the year: Date Cost Salvage GAAP Depr Office Furniture 6/1/2011 22,000 1,000 6,417 Machinery 12/1/2011 32,000 2,500 762 Tax Depr 3,927 1,600 Year 2011 2012 There was a 12-month insurance policy bought for $15,000 on 12/1/2011 and for tax purposes, the entire policy is expensed. There were $4,500 worth of meals purchased during the year of...
(In millions) Year Ended December 31, 2018 2017 Cash flows from operating activities Net income $ ...
(In millions) Year Ended December 31, 2018 2017 Cash flows from operating activities Net income $ 22,112 $ 15,934 Adjustments to reconcile net income to net cash provided by operating activities: Depreciation and amortization 4,315 3,025 Share-based compensation 4,152 3,723 Deferred income taxes 286 (377) Other (64) 24 Changes in assets and liabilities: Accounts receivable (1,892) (1,609) Prepaid expenses and other current assets (690) (192) Other assets (159) 154 Accounts payable 221 43 Partners payable 157 95 Accrued expenses and...
Using the information below. calculate net income for the period Sales revenues for the period Operating...
 Using the information below. calculate net income for the period Sales revenues for the period Operating expenses for the period Finished Goods Inventory, January 1 Finished Goods Inventory, December 31 Cost of goods manufactured for the period $1,308,000 243,000 40,000 45,000 544,000 $777.000 $436,000 10 0 0 0 C $526,000. $782,000
($ thousands) Sales Cost of goods sold Gross profit Operating expenses Net income HAROUN COMPANY Comparative...
 ($ thousands) Sales Cost of goods sold Gross profit Operating expenses Net income HAROUN COMPANY Comparative Income Statements For Years Ended December 31, 2019-2013 2019 2018 2017 2016 2015 2014 2013 $1,536 $1,345 $1,224 $1,122 $1,047 $ 974 $ 798 1. 104 628 587 468 387 330 258 236 151 149 124 $ 216 $ 272 268 $ 238 $ 206 HAROUN COMPANY Comparative Balance Sheets December 31, 2019-2013 2019 2018 2017 2016 2015 2014 2013 $ 96 693 2,508...
($ thousands) Sales Cost of goods sold Gross profit Operating expenses Net income HAROUN COMPANY Comparative...
 ($ thousands) Sales Cost of goods sold Gross profit Operating expenses Net income HAROUN COMPANY Comparative Income Statements For Years Ended December 31, 2019-2013 2019 2018 2017 2016 2015 2014 2013 $1,536 $1,345 $1,224 $1,122 $1,047 $ 974 $ 798 1,104 898 772 676 628 587 468 432 447 452 446419 387 330 329 258 236 174 151 149 124 $ 103 $ 189 $ 216 $ 272 $ 268 $ 238 $ 206 HAROUN COMPANY Comparative Balance Sheets December...
Sales Cost of goods sold Gross margin Selling and administrative expenses Net operating income (loss) Year...
 Sales Cost of goods sold Gross margin Selling and administrative expenses Net operating income (loss) Year 1 $1,000,000 740,000 260,000 230,000 $ 30,000 Year 2 $ 780,000 520,000 260,000 200,000 $ 60,000 Year 3 $1,000,000 785,000 215,000 230,000 $ (15,000) In the latter part of Year 2, a competitor went out of business and in the process dumped a large number of units on the market. result, Starfax's sales dropped by 20% during Year 2 even though production increased during...
Joyner Company’s income statement for Year 2 follows: Sales $ 711,000 Cost of goods sold 320,000 Gross margin 391,000 Selling and administrative expenses 217,000 Net operating income...
Joyner Company’s income statement for Year 2 follows: Sales $ 711,000 Cost of goods sold 320,000 Gross margin 391,000 Selling and administrative expenses 217,000 Net operating income 174,000 Nonoperating items: Gain on sale of equipment 7,000 Income before taxes 181,000 Income taxes 54,300 Net income $ 126,700 Its balance sheet amounts at the end of Years 1 and 2 are as follows: Year 2 Year 1 Assets Cash $ 54,100 $ 89,800 Accounts receivable 278,000 120,000 Inventory 320,000 272,000 Prepaid...
Compute and interpret the Z-score Information from the balance sheet, income statement, and statement of cash...
 Compute and interpret the Z-score Information from the balance sheet, income statement, and statement of cash flows for Nike follows. Refer to thes NIKE, INC. Consolidated Statements of Income Year Ended December 31 (In millions) 2019 2018 Revenues $39,117 $36,397 Cost of sales 21,643 20,441 Gross profit 17,474 15.956 Demand creation expense 3,753 3,577 Operating overhead expense 8,949 7.934 Total selling and administrative expense 12,702 11,511 Interest expense (income), net 49 54 Other (income) expense, net (78) 66 Income before...
 calculate total profit margin, asset turnover, return on assests
and return on net worth for jiranna healthcare. interpret the data
Jiranna Healthcare Cash Flows, 2013 (in thousands) Cash Flows from Operating Activities Cash received from patient and third-party payers Cash received from operating revenue sources Cash received from nonoperating revenue sources Cash payments to employees Cash payments to suppliers of goods and services $ 10,671 800 270 (5,600) (4,800) Net cash flow from operating activities $1,341 Cash flows from Investing...
calculate total profit margin, asset turnover, return on assests
and return on net worth for jiranna healthcare. interpret the data
Jiranna Healthcare Cash Flows, 2013 (in thousands) Cash Flows from Operating Activities Cash received from patient and third-party payers Cash received from operating revenue sources Cash received from nonoperating revenue sources Cash payments to employees Cash payments to suppliers of goods and services $ 10,671 800 270 (5,600) (4,800) Net cash flow from operating activities $1,341 Cash flows from Investing...
 GAAP/Tax Income Statement For Year Ended December 31, 2011 Revenue 810,524 Operating Expenses 647,578 Net Income 162,946 The following fixed assets were purchased during the year: Date Cost Salvage GAAP Depr Office Furniture 6/1/2011 22,000 1,000 6,417 Machinery 12/1/2011 32,000 2,500 762 Tax Depr 3,927 1,600 Year 2011 2012 There was a 12-month insurance policy bought for $15,000 on 12/1/2011 and for tax purposes, the entire policy is expensed. There were $4,500 worth of meals purchased during the year of...
 Using the information below. calculate net income for the period Sales revenues for the period Operating expenses for the period Finished Goods Inventory, January 1 Finished Goods Inventory, December 31 Cost of goods manufactured for the period $1,308,000 243,000 40,000 45,000 544,000 $777.000 $436,000 10 0 0 0 C $526,000. $782,000
 ($ thousands) Sales Cost of goods sold Gross profit Operating expenses Net income HAROUN COMPANY Comparative Income Statements For Years Ended December 31, 2019-2013 2019 2018 2017 2016 2015 2014 2013 $1,536 $1,345 $1,224 $1,122 $1,047 $ 974 $ 798 1. 104 628 587 468 387 330 258 236 151 149 124 $ 216 $ 272 268 $ 238 $ 206 HAROUN COMPANY Comparative Balance Sheets December 31, 2019-2013 2019 2018 2017 2016 2015 2014 2013 $ 96 693 2,508...
 ($ thousands) Sales Cost of goods sold Gross profit Operating expenses Net income HAROUN COMPANY Comparative Income Statements For Years Ended December 31, 2019-2013 2019 2018 2017 2016 2015 2014 2013 $1,536 $1,345 $1,224 $1,122 $1,047 $ 974 $ 798 1,104 898 772 676 628 587 468 432 447 452 446419 387 330 329 258 236 174 151 149 124 $ 103 $ 189 $ 216 $ 272 $ 268 $ 238 $ 206 HAROUN COMPANY Comparative Balance Sheets December...
 Sales Cost of goods sold Gross margin Selling and administrative expenses Net operating income (loss) Year 1 $1,000,000 740,000 260,000 230,000 $ 30,000 Year 2 $ 780,000 520,000 260,000 200,000 $ 60,000 Year 3 $1,000,000 785,000 215,000 230,000 $ (15,000) In the latter part of Year 2, a competitor went out of business and in the process dumped a large number of units on the market. result, Starfax's sales dropped by 20% during Year 2 even though production increased during...
 Compute and interpret the Z-score Information from the balance sheet, income statement, and statement of cash flows for Nike follows. Refer to thes NIKE, INC. Consolidated Statements of Income Year Ended December 31 (In millions) 2019 2018 Revenues $39,117 $36,397 Cost of sales 21,643 20,441 Gross profit 17,474 15.956 Demand creation expense 3,753 3,577 Operating overhead expense 8,949 7.934 Total selling and administrative expense 12,702 11,511 Interest expense (income), net 49 54 Other (income) expense, net (78) 66 Income before...
Most questions answered within 3 hours.
-
(63
#14)
which of the following statments best describes how chamging
the concentration of the substances...
asked 1 hour ago -
In the following reaction, which element is undergoing
oxidation: Na2SO3 + N2O --> N2 + Na2SO4...
asked 2 hours ago -
Which of the following pairs of ions have the same electron
configuration?
I: Br− and Se2−...
asked 5 hours ago -
The Foremost Composite Materials Company is planning a two-day
sales conference for October 19-20. The conference...
asked 5 hours ago -
3) Illustrate the observed pattern of relatedness of organisms
versus adaptations to specific conditions. This means...
asked 6 hours ago -
In winter a lake has a 0.35 m thick ice layer over 1.10 m of
water....
asked 6 hours ago -
Assuming the following has been encrypted with a Vigenere cipher
below, use the method(s) and assumptions...
asked 7 hours ago -
How would I use switch statements to write a program that will
take an input of...
asked 7 hours ago -
Imagine a reaction in which methane gas combusts at a constant
pressure of 1 atm and...
asked 7 hours ago -
Two parallel wires (each 12 m in length) are separated by a
distance of 0.065 m...
asked 7 hours ago -
Suppose there were three masses at the corner of uniform
equilateral triangle. The masses are m1...
asked 7 hours ago -
Situation: A building that is 618 m above the ground floor. How
many times would a...
asked 7 hours ago