At the bottom of each data set, provide a brief narrative description of the progress of the project and its current status. There is no need to address every data point. I would prefer that you look for trends and identify sections of the project as given in the data. For example, you might say, "In the first half of this project, everything appears to be on track, but in the last third the schedule starts to slip."Assume the data is for a current project. Indicate what you would investigate (if anything) in order to identify the source of a problem.
1.
2.
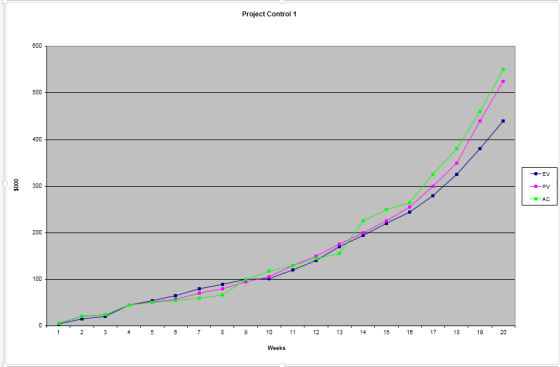
Project Control 1 EV PV AC 8 300 200 100 8 01 12 11415 8 7 1920 Weeks
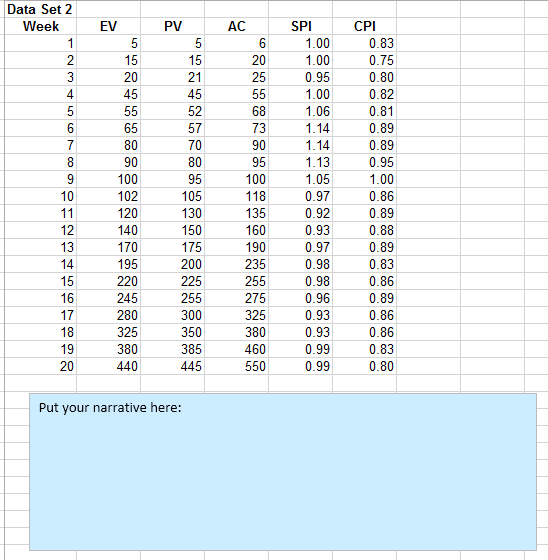
Data Set 2 Week EV PV AC SPI CPI 1.00 1.00 0.95 1.00 1.06 1.14 1.14 1.13 1.05 0.97 0.92 0.93 0.97 0.98 0.98 0.96 0.93 0.93 0.99 0.99 0.83 0.75 0.80 0.82 0.81 0.89 0.89 0.95 1.00 0.86 0.89 0.88 0.89 0.83 0.86 0.89 0.86 0.86 0.83 0.80 20 25 20 45 65 80 90 100 102 120 140 170 195 220 245 280 325 380 440 21 45 52 57 70 80 95 105 130 150 175 200 225 255 300 350 385 445 68 73 90 95 100 118 135 160 190 235 255 275 325 380 460 550 13 17 20 Put your narrative here:
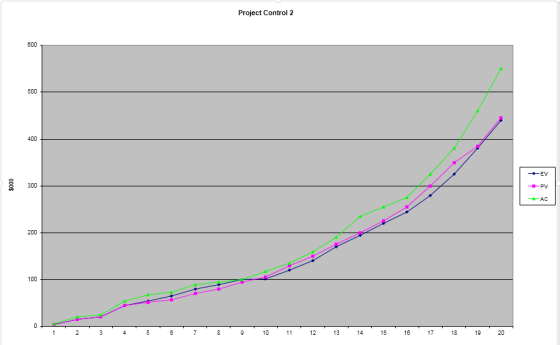
Project Control 2 800 400 300 PV 200 100 18
Homework Answers
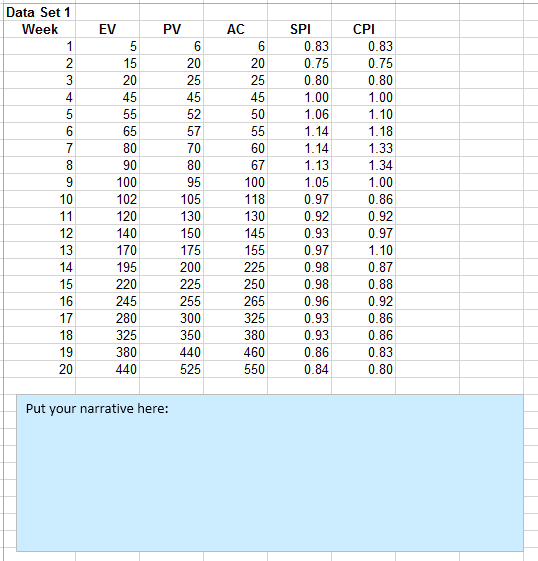
Data set 1
Narrative: In the first 13 weeks of the project, AC is lower than EV, which indicates that the project was under budget. However, from 14th week onwards, cost overrun startsand from there onwards, the project is consistently over the budget.
Upto week 9, EV is greater than PV, which means the project is ahead of schedule, however, from week 10 onwards, the PV crosses over and is consistently higher than EV, indicating the project is behind schedule.
There seems to be some problem that disrupted the projected cost around week 13 and the project schedule around 10. This needs to be investigated.
Data set 2
Narrative: AC is constistently higher than EV, indicating that the project was over budget right from the beginning. This indicates that the project budgeting was wrong. The cost overrun is pretty steep towards the end of the project, where the gap between the Actual cost and Earned Value becomes very high.
On the scheduling front, however, the project progress is rather satisfactory. Project is ahead of schedule upto 9, after which it slips slightly, but then catches up towards the end, to finish on schedule.
So, we can conclude that the project budgeting was wrong, which led to cost overruns. However, the progress of the project as per schedule was largely on track.
Add Answer to:
At the bottom of each data set, provide a brief narrative description of the progress of the proj...
The following results were obtained from an undrained shear box test carried out on a set...
 The following results were obtained from an undrained shear box test carried out on a set of undisturbed soil samples. 0.2 0.8 Normal Load (N) Strain (%) 1 2 3 4 5 6 7 8 9 10 11 12 13 14 15 16 17 18 0 21 46 70 89 107 121 131 136 138 138 137 136 0.4 Shearing force (N) 0 33 72 110 139 164 180 192 201 210 217 224 230 234 237 236 0 45...
bug fix of python here's the program: import binascii file = open("nibbles.txt", "r") count = 1...
bug fix of python here's the program: import binascii file = open("nibbles.txt", "r") count = 1 bytes = "" message = "" for i, line in enumerate(file): startIndex = line.index('(') endIndex = line.index(')') co = line[startIndex:endIndex+1] # (-1.35, 2.30) coordinates = line[startIndex+1:endIndex] # -1.35, 2.30 comma = coordinates.index(',') iVoltage = coordinates[0:comma] iv = float(iVoltage) qVoltage = coordinates[comma+2:] qv = float(qVoltage) if iv >= 0 and iv <= 2 and qv >= 0 and qv <= 2: point = "1101"...
Use Table 8.1, a computer, or a calculator to answer the following. Suppose a candidate for...
 Use Table 8.1, a computer, or a calculator to answer the following. Suppose a candidate for public office is favored by only 47% of the voters. If a sample survey randomly selects 2,500 voters, the percentage in the sample who favor the candidate can be thought of as a measurement from a normal curve with a mean of 47% and a standard deviation of 1%. Based on this information, how often (as a %) would such a survey show that...
find v belt drive design power select belt type determine shive size (belt speed 4000 ft/min)...
 find v belt drive
design power
select belt type
determine shive size (belt speed 4000 ft/min)
find shive size from power rating figure
find rated power
find estimated centre distance
find belt length (by selecting standard belt length)
calculate actual centre distance
find contact angle for small shieve
determine correct factors
calculate correct power per belt
no. of belt needed
V-Belt Designing Sample Problem . Given: A 4 cylinder diesel engine runs at 80 hp, 1800 rpm, to drive a...
find v belt drive
design power
select belt type
determine shive size (belt speed 4000 ft/min)
find shive size from power rating figure
find rated power
find estimated centre distance
find belt length (by selecting standard belt length)
calculate actual centre distance
find contact angle for small shieve
determine correct factors
calculate correct power per belt
no. of belt needed
V-Belt Designing Sample Problem . Given: A 4 cylinder diesel engine runs at 80 hp, 1800 rpm, to drive a...
Suppose 1000 coins are tossed. Use the normal curve approximation to the binomial distribution to find...
 Suppose 1000 coins are tossed. Use the normal curve approximation to the binomial distribution to find the probability of getting the following result. Exactly 495 heads Use the table of areas under the standard normal curve given below. Click here to view page 1. Click here to view page 2. Click here to view page 3. Click here to view page 4. Click here to view page 5. Click here to view page 6. The probability of getting exactly 495...
Suppose 16 coins are tossed. Use the normal curve approximation to the binomial distribution to find...
 Suppose 16 coins are tossed. Use the normal curve approximation to the binomial distribution to find the probability of getting the following result. More than 11 tails. Use the table of areas under the standard normal curve given below. Click here to view page 1. Click here to view page 2. Click here to view page 3. Click here to view page 4. Click here to view page 5. Click here to view page 6. Binomial probability = (Round to...
HELP needed urgently....Data and question is attacted below..... Thank you in advance there is no data...
 HELP needed urgently....Data and question is attacted below.....
Thank you in advance
there is no data link fir this data it’s all in photos.... thank
you
i
have already posted the question
We were unable to transcribe this imageNo. 2 3 4 5 6 7 8 Working Sector Public Own Public Public Private Public Private Private Own Own Private Public Public Public Private 9 10 11 12 13 Public IS 16 17 18 19 20 21 22 23 24 25...
HELP needed urgently....Data and question is attacted below.....
Thank you in advance
there is no data link fir this data it’s all in photos.... thank
you
i
have already posted the question
We were unable to transcribe this imageNo. 2 3 4 5 6 7 8 Working Sector Public Own Public Public Private Public Private Private Own Own Private Public Public Public Private 9 10 11 12 13 Public IS 16 17 18 19 20 21 22 23 24 25...
 The following results were obtained from an undrained shear box test carried out on a set of undisturbed soil samples. 0.2 0.8 Normal Load (N) Strain (%) 1 2 3 4 5 6 7 8 9 10 11 12 13 14 15 16 17 18 0 21 46 70 89 107 121 131 136 138 138 137 136 0.4 Shearing force (N) 0 33 72 110 139 164 180 192 201 210 217 224 230 234 237 236 0 45...
 The following results were obtained from an undrained shear box test carried out on a set of undisturbed soil samples. 0.2 0.8 Normal Load (N) Strain (%) 1 2 3 4 5 6 7 8 9 10 11 12 13 14 15 16 17 18 0 21 46 70 89 107 121 131 136 138 138 137 136 0.4 Shearing force (N) 0 33 72 110 139 164 180 192 201 210 217 224 230 234 237 236 0 45...
 Use Table 8.1, a computer, or a calculator to answer the following. Suppose a candidate for public office is favored by only 47% of the voters. If a sample survey randomly selects 2,500 voters, the percentage in the sample who favor the candidate can be thought of as a measurement from a normal curve with a mean of 47% and a standard deviation of 1%. Based on this information, how often (as a %) would such a survey show that...
 find v belt drive
design power
select belt type
determine shive size (belt speed 4000 ft/min)
find shive size from power rating figure
find rated power
find estimated centre distance
find belt length (by selecting standard belt length)
calculate actual centre distance
find contact angle for small shieve
determine correct factors
calculate correct power per belt
no. of belt needed
V-Belt Designing Sample Problem . Given: A 4 cylinder diesel engine runs at 80 hp, 1800 rpm, to drive a...
find v belt drive
design power
select belt type
determine shive size (belt speed 4000 ft/min)
find shive size from power rating figure
find rated power
find estimated centre distance
find belt length (by selecting standard belt length)
calculate actual centre distance
find contact angle for small shieve
determine correct factors
calculate correct power per belt
no. of belt needed
V-Belt Designing Sample Problem . Given: A 4 cylinder diesel engine runs at 80 hp, 1800 rpm, to drive a...
 Suppose 1000 coins are tossed. Use the normal curve approximation to the binomial distribution to find the probability of getting the following result. Exactly 495 heads Use the table of areas under the standard normal curve given below. Click here to view page 1. Click here to view page 2. Click here to view page 3. Click here to view page 4. Click here to view page 5. Click here to view page 6. The probability of getting exactly 495...
 Suppose 16 coins are tossed. Use the normal curve approximation to the binomial distribution to find the probability of getting the following result. More than 11 tails. Use the table of areas under the standard normal curve given below. Click here to view page 1. Click here to view page 2. Click here to view page 3. Click here to view page 4. Click here to view page 5. Click here to view page 6. Binomial probability = (Round to...
 HELP needed urgently....Data and question is attacted below.....
Thank you in advance
there is no data link fir this data it’s all in photos.... thank
you
i
have already posted the question
We were unable to transcribe this imageNo. 2 3 4 5 6 7 8 Working Sector Public Own Public Public Private Public Private Private Own Own Private Public Public Public Private 9 10 11 12 13 Public IS 16 17 18 19 20 21 22 23 24 25...
HELP needed urgently....Data and question is attacted below.....
Thank you in advance
there is no data link fir this data it’s all in photos.... thank
you
i
have already posted the question
We were unable to transcribe this imageNo. 2 3 4 5 6 7 8 Working Sector Public Own Public Public Private Public Private Private Own Own Private Public Public Public Private 9 10 11 12 13 Public IS 16 17 18 19 20 21 22 23 24 25...
Most questions answered within 3 hours.
-
The marketing class at CSUS had an average score of 150. An
educational analyst determined that...
asked 23 minutes ago -
Justin Case has purchased a $250 000 home by putting 20 % down
and taking out...
asked 33 minutes ago -
1. In a labor market, marginal cost for a firm is
____________.
a. recruiting cost
b....
asked 1 hour ago -
On January 1, 2019, ABC Company issued $60,000,000 of 20-year,
10.5% bonds when the market rate...
asked 1 hour ago -
39.4% of US homes continue to use a landline in addition to cell
phone service. 3...
asked 2 hours ago -
Starting with benzene, synthesize 1-phenyl-1-butyne.
Show intermediates and reagents.
asked 3 hours ago -
Create a 32-run crossed array design with six control factors
and two noise factors such that...
asked 3 hours ago -
A 500g sample of sand from source A has the following amounts
retained on each sieve....
asked 3 hours ago -
In
your own words, please explain the essay by John Keynes wrote "The
End of Laissez...
asked 3 hours ago -
How are the matrix and pixels related? Why are smaller
pixels better for diagnostic quality?
asked 4 hours ago -
2. An AC generator has 80 rectangular loops on
its armature. Each loop is 11 cm...
asked 4 hours ago -
Please help me with this question. Consider Aldi’s current and
potential geographic markets (see Exhibit 4...
asked 4 hours ago