(c) Write down Ho and Hi and determine whether there are differences in number of jobs between education levels. (Use a 0.05.) (d) Write down Ho and H and determine whether there is interaction between gender and education. (Use α = 0.05.)
Homework Answers
Answer a
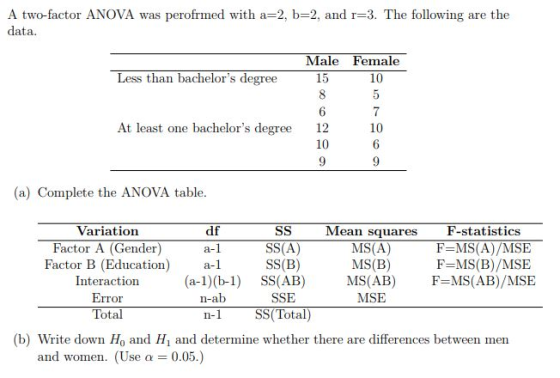
Given that the experiment has two factors (Factor Gender and Factor Education level ) at a = 2(Male and Female) and b = 2(less than bachelor degree and at least one bachelor degree) levels. Thus there are ab = 2× 2 = 4 different combinations of Gender and Education level.
With each combination r = 3 loads. r is called the number of replicates.This sums up to n = abr = 12 loads in total.
The Yijk denotes the no of observations for k (k = 1, 2, 3) with gender i (i = 1, 2) at education level j (j = 1, 2, 3) are recorded as follows
From the given data we can write
| Less than bachelor's degree | Mean | At least one bachelor's degree | Mean | mGender | |||||
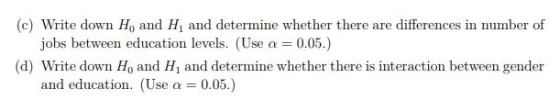
| Male | 15 | 8 | 6 | 9.67 | 12 | 10 | 9 | 10.33 | 10.00 |
| Female | 10 | 5 | 7 | 7.33 | 10 | 6 | 9 | 8.33 | 7.83 |
| meducation | 8.50 | 9.333 | 8.92 | ||||||

DF error is n-ab = 12 - 4 = 8
MSE = SSE/ DF = 8.83
![6 x[(10.00-8.92)^2 +(7.83-8.92)^2] = 2.35](http://img.homeworklib.com/images/24169eeb-96b1-4747-842d-00aba661ba42.png?x-oss-process=image/resize,w_560)
In similar way we can fill the ANOVA table
| Variation | df | SS | Mean squares | F - Statistics | P-value |
| Factor A(Gender) | 1 | 2.35 | 2.35 | 0.27 | 0.6200 |
| Factor B(Education) | 1 | 0.35 | 0.35 | 0.04 | 0.8472 |
| Interaction | 1 | 4.36 | 4.36 | 0.49 | 0.5023 |
| Error | 8 | 70.67 | 8.83 | ||
| Total | 11 | 77.72667 |
Answer b
Main Effect of Factor A(Gender):
H0:μM.=μF.
HA: not all μi. are equal where μi. is the mean for ith gender.
Now form ANOVA table we got the p value for Factor A is greater than 0.05.
Therefore we are unable to reject the null hypothesis at 0.05 level of significance and conclude that the no significant effect of gender .
Answer c
Main Effect of Factor B(Education level):
H0:μ.1=μ.2
HA: not all μ.j are equal where μi.is the mean for ith education
level
Again form ANOVA table we got the p value for Factor B is greater than 0.05.
Therefore we are unable to reject the null hypothesis at 0.05 level of significance and conclude that the there is not significant difference in education level as well.
Answer c
A × B Interaction:
H0: there is no interaction
HA: an interaction exists
ANOVA table says that p-value for interaction is also greater than 0.05 and we are unable to reject the null hypothesis.
Hence we can conclude that there no significant difference in education and gender together.
Add Answer to:
A two-factor ANOVA was perofrmed with a-2, b-2, and r-3. The following are the data Male Female L...
A sociologist classified 45 faculty members by subject matter of course (factor A with 4 levels) and highest degree earned (factor B with 3 levels) The first ANOVA table below is from a model includi...
 A sociologist classified 45 faculty members by subject matter of course (factor A with 4 levels) and highest degree earned (factor B with 3 levels) The first ANOVA table below is from a model including A and B main effects and AB interaction effects. The second one is from a model including B main effects and AB interaction effects but no A main effects Sequential sum of squares ANOVA table with A, B and AB terms. Analysis of Variance Source...
CH13 Q5 The following observations were obtained when conducting a two-way ANOVA experiment with no interaction....
 CH13 Q5
The following observations were obtained when conducting a two-way ANOVA experiment with no interaction. Factor A X for Factor B 2.500 8.000 13.750 Factor B 15 9.667 13 8.000 16 8.333 Xi for Factor A 6.000 X 8.083 a. Calculate SST, SSA, SSB, and SSE. (Round intermediate calculations to at least 4 decimal places. Round your answers to 2 decimal places.) SST SSA SSB SSE b. Calculate MSA, MSB, and MSE. (Round intermediate calculations to at least 4...
CH13 Q5
The following observations were obtained when conducting a two-way ANOVA experiment with no interaction. Factor A X for Factor B 2.500 8.000 13.750 Factor B 15 9.667 13 8.000 16 8.333 Xi for Factor A 6.000 X 8.083 a. Calculate SST, SSA, SSB, and SSE. (Round intermediate calculations to at least 4 decimal places. Round your answers to 2 decimal places.) SST SSA SSB SSE b. Calculate MSA, MSB, and MSE. (Round intermediate calculations to at least 4...
Exercise 13-45 Algo A researcher conducts a two-way ANOVA test with interaction and provides the following...
Exercise 13-45 Algo A researcher conducts a two-way ANOVA test with interaction and provides the following ANOVA table. a. Find the missing values in the ANOVA table. (Round intermediate calculations to at least 4 decimal places. Round "MS" to 4 decimal places and "F" to 3 decimal places.) ANOVA Source of Variation SS df MS F p-value Sample 776.84 2 MSB = F Factor B = 0.010 Columns 12,425.44 1 MSA = F Factor A = 4.57E-09 Interaction 56.25 2...
ANOVA Source of Variation SS df MS F p-value Factor A 30,865.45 3 10,288.48 Factor B...
ANOVA Source of Variation SS df MS F p-value Factor A 30,865.45 3 10,288.48 Factor B 22,557.30 2 11,278.65 Interaction 119,155.58 6 19,859.26 Error 90,553.57 36 2,515.38 Total 263,131.90 47 (a) What kind of ANOVA is this? One-factor ANOVA Two-factor ANOVA with replication Two-factor ANOVA without replication (b) Calculate each F test statistic and the p-value for each F test using Excel's function =F.DIST.RT(F,DF1,DF2). (Round your Fcalcvalues to 3 decimal places and p-values to 4 decimal places.) Source of Variation...
3. (20 points) A partially completed ANOVA table for a two-factor factorial experiment is shown here:...
 3. (20 points) A partially completed ANOVA table for a two-factor factorial experiment is shown here: Source df SS 3 1 0.95 MS F 0.75 0.30 AB Error Total 23 6.5 a Give the number of levels for each factor. b How many observations were collected for each factor-level combination? c Complete the ANOVA table above. d Test to determine whether the treatment means differ using a = 0.10?
The following table shows the results of a two-factor ANOVA evaluating an independent-measures experiment with three...
The following table shows the results of a two-factor ANOVA evaluating an independent-measures experiment with three levels of factor A, three levels of factor B, and n = 10 participants in each treatment condition. a. What is the calculated F value for the interaction? Source SS df MS Between Treatments 124 Factor A 20 10 F A= Factor B 42 F B= A*B 20 F A*B=? Within Treatments 324 Total 1. F=13 2. F=5 3. F=2.5 4. F =...
Consider the following partially completed two-way ANOVA table. Suppose there are four levels of Factor A...
 Consider the following partially completed two-way ANOVA table. Suppose there are four levels of Factor A and two levels of Factor B. The number of replications per cell is 4. Use the 0.01 significance level. (Hint: Estimate the values from the Ftable.) a. Complete an ANOVA table. (Round MS and Fto 2 decimal places.) ANOVA SS df MS F Source Factor A 70 3 1.40 Factor B 50 11 23.33 50.00 70.00 3.00 Interaction 210 3 4.20 Error 24 16.67...
ANOVA Source of Variation SS df MS F p-value Factor A 35,166.79 3 11,722.26 Factor...
ANOVA Source of Variation SS df MS F p-value Factor A 35,166.79 3 11,722.26 Factor B 22,297.66 2 11,148.83 Interaction 206,903.76 6 34,483.96 Error 125,290.42 36 3,480.29 Total 389,658.63 47 (a) What kind of ANOVA is this? One-factor ANOVA Two-factor ANOVA with replication Two-factor ANOVA without replication (b) Calculate each F test statistic and the p-value for each F test using Excel's function =F.DIST.RT(F,DF1,DF2). (Round your Fcalc values to 3 decimal places and p-values to...
please show work for each! ΑΙ Factor B B. B2 T = 40 T = 10...
 please show work for each!
ΑΙ Factor B B. B2 T = 40 T = 10 M=4 M= 1 SS-50 SS = 30 Factor A A2 T-50 M=5 SS - 60 T = 20 M = 2 SS = 40 N-40 G = 120 EX =640 Use a two-way ANOVA with a=0.05 to evaluate the main effects and the interaction. m Source SS df MS F Between treatments | 1 6.67 I 2.00 Factor A (ROWS) 18.00 Factor B (COLUMNS)...
please show work for each!
ΑΙ Factor B B. B2 T = 40 T = 10 M=4 M= 1 SS-50 SS = 30 Factor A A2 T-50 M=5 SS - 60 T = 20 M = 2 SS = 40 N-40 G = 120 EX =640 Use a two-way ANOVA with a=0.05 to evaluate the main effects and the interaction. m Source SS df MS F Between treatments | 1 6.67 I 2.00 Factor A (ROWS) 18.00 Factor B (COLUMNS)...
Aa Aa 11. Two-factor ANOVA Emphasis on calculations W.Thomas Boyce, a professor and pediatrician at the University of British Columbia, Vancouver, has studied interactions between individual differen...
 Aa Aa 11. Two-factor ANOVA Emphasis on calculations W.Thomas Boyce, a professor and pediatrician at the University of British Columbia, Vancouver, has studied interactions between individual differences in physiology and differences in experience in determining health and well-being. Dr. Boyce found that some children are more sensitive to their environments. They do exceptionally wel when the environment is suppo「tive but are much more likely to have mental and physical health problems when the environment has challenges. You decide to do...
 A sociologist classified 45 faculty members by subject matter of course (factor A with 4 levels) and highest degree earned (factor B with 3 levels) The first ANOVA table below is from a model including A and B main effects and AB interaction effects. The second one is from a model including B main effects and AB interaction effects but no A main effects Sequential sum of squares ANOVA table with A, B and AB terms. Analysis of Variance Source...
 CH13 Q5
The following observations were obtained when conducting a two-way ANOVA experiment with no interaction. Factor A X for Factor B 2.500 8.000 13.750 Factor B 15 9.667 13 8.000 16 8.333 Xi for Factor A 6.000 X 8.083 a. Calculate SST, SSA, SSB, and SSE. (Round intermediate calculations to at least 4 decimal places. Round your answers to 2 decimal places.) SST SSA SSB SSE b. Calculate MSA, MSB, and MSE. (Round intermediate calculations to at least 4...
CH13 Q5
The following observations were obtained when conducting a two-way ANOVA experiment with no interaction. Factor A X for Factor B 2.500 8.000 13.750 Factor B 15 9.667 13 8.000 16 8.333 Xi for Factor A 6.000 X 8.083 a. Calculate SST, SSA, SSB, and SSE. (Round intermediate calculations to at least 4 decimal places. Round your answers to 2 decimal places.) SST SSA SSB SSE b. Calculate MSA, MSB, and MSE. (Round intermediate calculations to at least 4...
 3. (20 points) A partially completed ANOVA table for a two-factor factorial experiment is shown here: Source df SS 3 1 0.95 MS F 0.75 0.30 AB Error Total 23 6.5 a Give the number of levels for each factor. b How many observations were collected for each factor-level combination? c Complete the ANOVA table above. d Test to determine whether the treatment means differ using a = 0.10?
 Consider the following partially completed two-way ANOVA table. Suppose there are four levels of Factor A and two levels of Factor B. The number of replications per cell is 4. Use the 0.01 significance level. (Hint: Estimate the values from the Ftable.) a. Complete an ANOVA table. (Round MS and Fto 2 decimal places.) ANOVA SS df MS F Source Factor A 70 3 1.40 Factor B 50 11 23.33 50.00 70.00 3.00 Interaction 210 3 4.20 Error 24 16.67...
 please show work for each!
ΑΙ Factor B B. B2 T = 40 T = 10 M=4 M= 1 SS-50 SS = 30 Factor A A2 T-50 M=5 SS - 60 T = 20 M = 2 SS = 40 N-40 G = 120 EX =640 Use a two-way ANOVA with a=0.05 to evaluate the main effects and the interaction. m Source SS df MS F Between treatments | 1 6.67 I 2.00 Factor A (ROWS) 18.00 Factor B (COLUMNS)...
please show work for each!
ΑΙ Factor B B. B2 T = 40 T = 10 M=4 M= 1 SS-50 SS = 30 Factor A A2 T-50 M=5 SS - 60 T = 20 M = 2 SS = 40 N-40 G = 120 EX =640 Use a two-way ANOVA with a=0.05 to evaluate the main effects and the interaction. m Source SS df MS F Between treatments | 1 6.67 I 2.00 Factor A (ROWS) 18.00 Factor B (COLUMNS)...
 Aa Aa 11. Two-factor ANOVA Emphasis on calculations W.Thomas Boyce, a professor and pediatrician at the University of British Columbia, Vancouver, has studied interactions between individual differences in physiology and differences in experience in determining health and well-being. Dr. Boyce found that some children are more sensitive to their environments. They do exceptionally wel when the environment is suppo「tive but are much more likely to have mental and physical health problems when the environment has challenges. You decide to do...
Most questions answered within 3 hours.
-
The following results were obtained as
part of a multiple regression analysis involving 3 independent
variables:...
asked 5 minutes ago -
The time to complete a standardized exam is approximately normal
with a mean of 70 minutes...
asked 2 hours ago -
Two thousand randomly selected adults were asked whether or not
they have ever shopped on the...
asked 2 hours ago -
Estimate the diffusion coefficient for methyl phenyl sulfide in
water at 25 degrees Celcius.
asked 1 hour ago -
10.g of a certain metal absorb 40. cal of heat and the temperature
is abserved to...
asked 2 hours ago -
How many milliliters of 0.0695 M Ca( OH)
2would be required to exactly neutralize 176 mL...
asked 2 hours ago -
A telephone survey uses a random digit dialing machine to call
subjects. The random digit dialing...
asked 3 hours ago -
How can having too little or too much of a certain
protein cause problems for an...
asked 4 hours ago -
Assume a muscle has a PCSA = 20 cm2 and Lo = 12 cm. Assume it...
asked 6 hours ago -
What is the yield to maturity of a ten-year, $1,000 bond with a
5.2% coupon rate...
asked 7 hours ago -
A mass m = 5 kg is tied on one end of a rope and is...
asked 7 hours ago -
The Average sales price of single-family houses in Charlotte is
$210,000 with a standard deviation of...
asked 7 hours ago