


Price per share = 67.39
PLease calculate the following ratios
Return on Asset (ROA)
Net Profit Margin
----------
Price to Earnings ratio
Book-to-market Ratio
CONSOLIDATED STATEMENT OF COMPREHENSIVE INCOME (LOSS)- 12 USD (S) $ in Millions Dec. 31, 2017D Statement Of Income And Comprehensive Income [Abstract] Net income (loss) Currency translation adjustments Unrealized net change arising during the s (1,513) period Marketable securities Unrealized gain (loss) arising during the period Reclassification to net income - impairment charge Cash flow hedges Net gain (loss) on cash flow hedges Reclassification to net income (loss) of net realized loss Actuarial gain (loss) Actuarial gain (loss) arising during the 134 period Amortization to net income (loss) of net 159 actuarial loss Prior service cost Amortization to net income (loss) of net 80 prior service cost (15) (1,144) postretirement benefit plans Comprehensive income (loss) Comprehensive income (loss) attributable to noncontrolling interests Comprehensive income (loss) attributable to Schlumberger s (1,136)
Homework Answers
Here, in the question provided to us we are required to calculate ROA, Net Profit Margin, Price to Earnings Ratio, Book to market ratio.
Return on Asset = Net income / average Total assets
Net Income = -$1513
Average total assets= $71987
Therefore, ROA = -1513/71987
= -2.10%
Net Profit margin = Net Profit / Revenue
Net Profit = -$1513
Revenue = $30440
Therefore, Net profit margin = -1513/30440
= -4.97%
Price to Earnings ratio = Price per share / Earnings per share
Price per share = 67.39
Earnings per share = -1.08
Therefore, Price to Earnings ratio = 67.39/-1.08
= -62.4
Book to Market ratio = Book value/ market value
Book value =
Market value = 67.39
Add Answer to:
Price per share = 67.39 PLease calculate the following ratios Return on Asset (ROA) Net Profit Ma...
Create a vertical analysis for 2017-2018 for this income statement: WOLVERINE WORLD WIDE, INC. AND SUBSIDIARIES...
 Create a vertical analysis for 2017-2018 for this income
statement:
WOLVERINE WORLD WIDE, INC. AND SUBSIDIARIES Consolidated Statements of Comprehensive Income Fiscal Year 2017 2018 2016 $ 200.3 $ (0.7) $ 87.5 (20.5) 21.1 (6.6) (16.0) 3.5 (0.7) (4.7) (In millions) Net earnings (loss) Other comprehensive income (loss) net of tax: Foreign currency translation adjustments Unrealized gain (loss) on derivative instruments: Unrealized gain (loss) arising during the period, net of taxes of $1.3, $(7.0) and $1.9 Reclassification adjustments included in...
Create a vertical analysis for 2017-2018 for this income
statement:
WOLVERINE WORLD WIDE, INC. AND SUBSIDIARIES Consolidated Statements of Comprehensive Income Fiscal Year 2017 2018 2016 $ 200.3 $ (0.7) $ 87.5 (20.5) 21.1 (6.6) (16.0) 3.5 (0.7) (4.7) (In millions) Net earnings (loss) Other comprehensive income (loss) net of tax: Foreign currency translation adjustments Unrealized gain (loss) on derivative instruments: Unrealized gain (loss) arising during the period, net of taxes of $1.3, $(7.0) and $1.9 Reclassification adjustments included in...
2016 part c -- Please calculate the following ratios Price per share = 83.95 Return on Asset (RO...
 2016 part c
--
Please calculate the following ratios
Price per share = 83.95
Return on Asset (ROA)
Net Profit Margin
----------
Price to Earnings ratio
Book-to-market Ratio
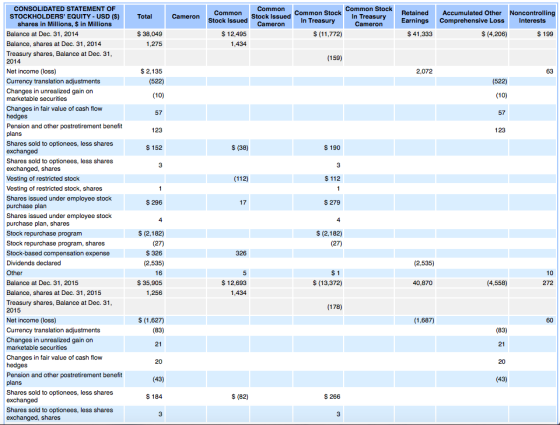
We were unable to transcribe this imageCONSOLIDATED STATEMENT OF STOCKHOLDERS' EQUITY-USD (S) shares in Millions, $ in Millions Common Stock In Common Stock In Accumulated Other Total Cameron Common Stock Common Stock Balance at Dec. 31, 2013 Balance, shares at Dec. 31, 2013 Treasury shares, Balance at Dec. 31 S 12,192 1,434...
2016 part c
--
Please calculate the following ratios
Price per share = 83.95
Return on Asset (ROA)
Net Profit Margin
----------
Price to Earnings ratio
Book-to-market Ratio
We were unable to transcribe this imageCONSOLIDATED STATEMENT OF STOCKHOLDERS' EQUITY-USD (S) shares in Millions, $ in Millions Common Stock In Common Stock In Accumulated Other Total Cameron Common Stock Common Stock Balance at Dec. 31, 2013 Balance, shares at Dec. 31, 2013 Treasury shares, Balance at Dec. 31 S 12,192 1,434...
Business Course Gross Profit Percentage The following financial data is from Brenner Instruments' financial statements (thousands...
 Business Course Gross Profit Percentage The following financial data is from Brenner Instruments' financial statements (thousands of dollars, except earnings per share.) 2019 Sales revenue Cost of goods sold Net income Dividends Earnings per share $210,000 125,000 8,300 2,600 4.15 Support Business Course $18,300 Assets Cash Accounts receivable (net) Inventory Total current assets Plant assets (net) Other assets Total assets Liabilities and Stockholders' Equity Notes payable-banks Accounts payable Accrued liabilities 46,000 39,500 103,800 52,600 15,600 $172,000 $18,000 41,000 43,700 102,700...
Problem 17-9 On January 1, 2017, Shamrock Inc. had the following balance sheet. SHAMROCK INC. BALANCE...
 Problem 17-9
On January 1, 2017, Shamrock Inc. had the following balance
sheet.
SHAMROCK INC.
BALANCE SHEET
AS OF JANUARY 1, 2017
Assets
Equity
Cash
$51,800
Common stock
$249,100
Debt investments (available-for-sale)
247,100
Accumulated other comprehensive income
49,800
Total
$298,900
Total
$298,900
The accumulated other comprehensive income related to unrealized
holding gains on available-for-sale debt securities. The fair value
of Shamrock Inc.’s available-for-sale debt securities at December
31, 2017, was $212,800; its cost was $151,800. No securities were
purchased during...
Problem 17-9
On January 1, 2017, Shamrock Inc. had the following balance
sheet.
SHAMROCK INC.
BALANCE SHEET
AS OF JANUARY 1, 2017
Assets
Equity
Cash
$51,800
Common stock
$249,100
Debt investments (available-for-sale)
247,100
Accumulated other comprehensive income
49,800
Total
$298,900
Total
$298,900
The accumulated other comprehensive income related to unrealized
holding gains on available-for-sale debt securities. The fair value
of Shamrock Inc.’s available-for-sale debt securities at December
31, 2017, was $212,800; its cost was $151,800. No securities were
purchased during...
Please Calculate the following ratios Total Debt Ratio Debt/Equity Ratio Cash flow from operation...
 Please Calculate the following ratios
Total Debt Ratio
Debt/Equity Ratio
Cash flow from operations/total liabilities
----------
Return on Equity (ROE)
(112) 17 s (2182) (2,535) (2,535) 10 $ 12,693 1,434 (13,372) Balance at Dec. 31, 2015 Balance, shares at Dec. 31, 2015 40,870 4,558) 272 (1,687) marketable securities Changes in fair value of cash flow (43) Vesting of restricted stock, shares $ 286 s (778) Stock repurchase program, shares (2,713) $10,027 138 $ 103 $ 9,924 138 shares Acquisition of...
Please Calculate the following ratios
Total Debt Ratio
Debt/Equity Ratio
Cash flow from operations/total liabilities
----------
Return on Equity (ROE)
(112) 17 s (2182) (2,535) (2,535) 10 $ 12,693 1,434 (13,372) Balance at Dec. 31, 2015 Balance, shares at Dec. 31, 2015 40,870 4,558) 272 (1,687) marketable securities Changes in fair value of cash flow (43) Vesting of restricted stock, shares $ 286 s (778) Stock repurchase program, shares (2,713) $10,027 138 $ 103 $ 9,924 138 shares Acquisition of...
Exercise 4-17 (Part Level Submission) The following information was taken from the records of Culver Inc....
 Exercise 4-17 (Part Level Submission) The following information was taken from the records of Culver Inc. for the year 2017: Income tax applicable to income from continuing operations $ 166,702; income tax applicable to loss on discontinued operations $26,724, and unrealized holding gain on available-for-sale securities (net of tax) $22,100. Gain on sale of equipment Loss on discontinued operations Administrative expenses Rent revenue Loss on write-down of inventory $98,800 78,600 241,200 48,600 69,800 Cash dividends declared Retained earnings January 1,...
Need help with this prob please! Problem 4-12 Joe Schreiner, controller for Blue Spruce Company Inc.,...
 Need help with this prob please!
Problem 4-12 Joe Schreiner, controller for Blue Spruce Company Inc., recently prepared the company's income statement and statement of changes in equity for 2017. Schreiner believes that the statements are a fair presentation of the company's financial progress during the current period, but he also admits that he has not examined any recent professional pronouncements on accounting BLUE SPRUCE COMPANY INC Income Statement For the Year Ended December 31, 2017 Sales revenue:s Less: Sales...
Need help with this prob please!
Problem 4-12 Joe Schreiner, controller for Blue Spruce Company Inc., recently prepared the company's income statement and statement of changes in equity for 2017. Schreiner believes that the statements are a fair presentation of the company's financial progress during the current period, but he also admits that he has not examined any recent professional pronouncements on accounting BLUE SPRUCE COMPANY INC Income Statement For the Year Ended December 31, 2017 Sales revenue:s Less: Sales...
Profitability ratios help in the analysis of the combined impact of liquidity ratios, asset management ratios,...
 Profitability ratios help in the analysis of the combined impact of liquidity ratios, asset management ratios, and debt management ratios on the operating performance of a firm Your boss has asked you to calculate the profitability ratios of Diusitech Inc. and make comments on its second-year performance as compared to its first-year performance The following shows Diusitech Inc.'s income statement for the last two years. The company had assets of $10,575 million in the first year and 16,916 million in...
Case 3 $ 289 Net loss (gain)-AOCI, Jan. 1 2018 loss (gain) on plan assets 2018 loss (gain) on PBO Accumulated benefit...
 Case 3 $ 289 Net loss (gain)-AOCI, Jan. 1 2018 loss (gain) on plan assets 2018 loss (gain) on PBO Accumulated benefit obligation, Jan. 1 Projected benefit obligation, Jan. 1 Fair value of plan assets, Jan. 1 Average remaining service period of active employees (years) Case 1 $ 339 (30) (42) (3,140) (3,500) 2,990 ($ in 800's) Case 2 $ (417) (27) 35 (2,740) (2,860) 2,890 (298) (1,640) (1,890) 1,740 14 16 10 We were unable to transcribe this imageRequired...
Calculate 1. Return on assets, 2. profit margin, 3. working capital, 4. current ratio, 5. current...
 Calculate 1. Return on assets, 2. profit margin, 3. working
capital, 4. current ratio, 5. current debt cash coverage, 6, debt
to total assets ratio, 7. cash debt coverage.
Financial statements INCOME STATEMENT For the year ended 30 June 2019 Consolidated RESTATED 2019 2018 $m $m Note 1 27,920 26,763 2 (16,344) (4,290) Continuing operations Revenue Expenses Raw materials and inventory Employee benefits expense Freight and other related expenses Occupancy-related expenses Depreciation and amortisation Impairment expenses Other expenses Total expenses...
Calculate 1. Return on assets, 2. profit margin, 3. working
capital, 4. current ratio, 5. current debt cash coverage, 6, debt
to total assets ratio, 7. cash debt coverage.
Financial statements INCOME STATEMENT For the year ended 30 June 2019 Consolidated RESTATED 2019 2018 $m $m Note 1 27,920 26,763 2 (16,344) (4,290) Continuing operations Revenue Expenses Raw materials and inventory Employee benefits expense Freight and other related expenses Occupancy-related expenses Depreciation and amortisation Impairment expenses Other expenses Total expenses...
 Create a vertical analysis for 2017-2018 for this income
statement:
WOLVERINE WORLD WIDE, INC. AND SUBSIDIARIES Consolidated Statements of Comprehensive Income Fiscal Year 2017 2018 2016 $ 200.3 $ (0.7) $ 87.5 (20.5) 21.1 (6.6) (16.0) 3.5 (0.7) (4.7) (In millions) Net earnings (loss) Other comprehensive income (loss) net of tax: Foreign currency translation adjustments Unrealized gain (loss) on derivative instruments: Unrealized gain (loss) arising during the period, net of taxes of $1.3, $(7.0) and $1.9 Reclassification adjustments included in...
Create a vertical analysis for 2017-2018 for this income
statement:
WOLVERINE WORLD WIDE, INC. AND SUBSIDIARIES Consolidated Statements of Comprehensive Income Fiscal Year 2017 2018 2016 $ 200.3 $ (0.7) $ 87.5 (20.5) 21.1 (6.6) (16.0) 3.5 (0.7) (4.7) (In millions) Net earnings (loss) Other comprehensive income (loss) net of tax: Foreign currency translation adjustments Unrealized gain (loss) on derivative instruments: Unrealized gain (loss) arising during the period, net of taxes of $1.3, $(7.0) and $1.9 Reclassification adjustments included in...
 2016 part c
--
Please calculate the following ratios
Price per share = 83.95
Return on Asset (ROA)
Net Profit Margin
----------
Price to Earnings ratio
Book-to-market Ratio
We were unable to transcribe this imageCONSOLIDATED STATEMENT OF STOCKHOLDERS' EQUITY-USD (S) shares in Millions, $ in Millions Common Stock In Common Stock In Accumulated Other Total Cameron Common Stock Common Stock Balance at Dec. 31, 2013 Balance, shares at Dec. 31, 2013 Treasury shares, Balance at Dec. 31 S 12,192 1,434...
2016 part c
--
Please calculate the following ratios
Price per share = 83.95
Return on Asset (ROA)
Net Profit Margin
----------
Price to Earnings ratio
Book-to-market Ratio
We were unable to transcribe this imageCONSOLIDATED STATEMENT OF STOCKHOLDERS' EQUITY-USD (S) shares in Millions, $ in Millions Common Stock In Common Stock In Accumulated Other Total Cameron Common Stock Common Stock Balance at Dec. 31, 2013 Balance, shares at Dec. 31, 2013 Treasury shares, Balance at Dec. 31 S 12,192 1,434...
 Business Course Gross Profit Percentage The following financial data is from Brenner Instruments' financial statements (thousands of dollars, except earnings per share.) 2019 Sales revenue Cost of goods sold Net income Dividends Earnings per share $210,000 125,000 8,300 2,600 4.15 Support Business Course $18,300 Assets Cash Accounts receivable (net) Inventory Total current assets Plant assets (net) Other assets Total assets Liabilities and Stockholders' Equity Notes payable-banks Accounts payable Accrued liabilities 46,000 39,500 103,800 52,600 15,600 $172,000 $18,000 41,000 43,700 102,700...
 Problem 17-9
On January 1, 2017, Shamrock Inc. had the following balance
sheet.
SHAMROCK INC.
BALANCE SHEET
AS OF JANUARY 1, 2017
Assets
Equity
Cash
$51,800
Common stock
$249,100
Debt investments (available-for-sale)
247,100
Accumulated other comprehensive income
49,800
Total
$298,900
Total
$298,900
The accumulated other comprehensive income related to unrealized
holding gains on available-for-sale debt securities. The fair value
of Shamrock Inc.’s available-for-sale debt securities at December
31, 2017, was $212,800; its cost was $151,800. No securities were
purchased during...
Problem 17-9
On January 1, 2017, Shamrock Inc. had the following balance
sheet.
SHAMROCK INC.
BALANCE SHEET
AS OF JANUARY 1, 2017
Assets
Equity
Cash
$51,800
Common stock
$249,100
Debt investments (available-for-sale)
247,100
Accumulated other comprehensive income
49,800
Total
$298,900
Total
$298,900
The accumulated other comprehensive income related to unrealized
holding gains on available-for-sale debt securities. The fair value
of Shamrock Inc.’s available-for-sale debt securities at December
31, 2017, was $212,800; its cost was $151,800. No securities were
purchased during...
 Please Calculate the following ratios
Total Debt Ratio
Debt/Equity Ratio
Cash flow from operations/total liabilities
----------
Return on Equity (ROE)
(112) 17 s (2182) (2,535) (2,535) 10 $ 12,693 1,434 (13,372) Balance at Dec. 31, 2015 Balance, shares at Dec. 31, 2015 40,870 4,558) 272 (1,687) marketable securities Changes in fair value of cash flow (43) Vesting of restricted stock, shares $ 286 s (778) Stock repurchase program, shares (2,713) $10,027 138 $ 103 $ 9,924 138 shares Acquisition of...
Please Calculate the following ratios
Total Debt Ratio
Debt/Equity Ratio
Cash flow from operations/total liabilities
----------
Return on Equity (ROE)
(112) 17 s (2182) (2,535) (2,535) 10 $ 12,693 1,434 (13,372) Balance at Dec. 31, 2015 Balance, shares at Dec. 31, 2015 40,870 4,558) 272 (1,687) marketable securities Changes in fair value of cash flow (43) Vesting of restricted stock, shares $ 286 s (778) Stock repurchase program, shares (2,713) $10,027 138 $ 103 $ 9,924 138 shares Acquisition of...
 Exercise 4-17 (Part Level Submission) The following information was taken from the records of Culver Inc. for the year 2017: Income tax applicable to income from continuing operations $ 166,702; income tax applicable to loss on discontinued operations $26,724, and unrealized holding gain on available-for-sale securities (net of tax) $22,100. Gain on sale of equipment Loss on discontinued operations Administrative expenses Rent revenue Loss on write-down of inventory $98,800 78,600 241,200 48,600 69,800 Cash dividends declared Retained earnings January 1,...
 Need help with this prob please!
Problem 4-12 Joe Schreiner, controller for Blue Spruce Company Inc., recently prepared the company's income statement and statement of changes in equity for 2017. Schreiner believes that the statements are a fair presentation of the company's financial progress during the current period, but he also admits that he has not examined any recent professional pronouncements on accounting BLUE SPRUCE COMPANY INC Income Statement For the Year Ended December 31, 2017 Sales revenue:s Less: Sales...
Need help with this prob please!
Problem 4-12 Joe Schreiner, controller for Blue Spruce Company Inc., recently prepared the company's income statement and statement of changes in equity for 2017. Schreiner believes that the statements are a fair presentation of the company's financial progress during the current period, but he also admits that he has not examined any recent professional pronouncements on accounting BLUE SPRUCE COMPANY INC Income Statement For the Year Ended December 31, 2017 Sales revenue:s Less: Sales...
 Profitability ratios help in the analysis of the combined impact of liquidity ratios, asset management ratios, and debt management ratios on the operating performance of a firm Your boss has asked you to calculate the profitability ratios of Diusitech Inc. and make comments on its second-year performance as compared to its first-year performance The following shows Diusitech Inc.'s income statement for the last two years. The company had assets of $10,575 million in the first year and 16,916 million in...
 Case 3 $ 289 Net loss (gain)-AOCI, Jan. 1 2018 loss (gain) on plan assets 2018 loss (gain) on PBO Accumulated benefit obligation, Jan. 1 Projected benefit obligation, Jan. 1 Fair value of plan assets, Jan. 1 Average remaining service period of active employees (years) Case 1 $ 339 (30) (42) (3,140) (3,500) 2,990 ($ in 800's) Case 2 $ (417) (27) 35 (2,740) (2,860) 2,890 (298) (1,640) (1,890) 1,740 14 16 10 We were unable to transcribe this imageRequired...
 Calculate 1. Return on assets, 2. profit margin, 3. working
capital, 4. current ratio, 5. current debt cash coverage, 6, debt
to total assets ratio, 7. cash debt coverage.
Financial statements INCOME STATEMENT For the year ended 30 June 2019 Consolidated RESTATED 2019 2018 $m $m Note 1 27,920 26,763 2 (16,344) (4,290) Continuing operations Revenue Expenses Raw materials and inventory Employee benefits expense Freight and other related expenses Occupancy-related expenses Depreciation and amortisation Impairment expenses Other expenses Total expenses...
Calculate 1. Return on assets, 2. profit margin, 3. working
capital, 4. current ratio, 5. current debt cash coverage, 6, debt
to total assets ratio, 7. cash debt coverage.
Financial statements INCOME STATEMENT For the year ended 30 June 2019 Consolidated RESTATED 2019 2018 $m $m Note 1 27,920 26,763 2 (16,344) (4,290) Continuing operations Revenue Expenses Raw materials and inventory Employee benefits expense Freight and other related expenses Occupancy-related expenses Depreciation and amortisation Impairment expenses Other expenses Total expenses...
Most questions answered within 3 hours.
-
A nozzle with a radius of 0.250 cm is attached to a garden hose
with a...
asked 1 minute ago -
Please help me with me. I did the first part to write the operations but in...
asked 7 minutes ago -
PLEASE do not use any loops for the program; only recursion is
allowed
4. Write a...
asked 10 minutes ago -
Use Cryptool to find the Cryptographic SHA-1 hash value of the
string "abc". The calculator is...
asked 11 minutes ago -
You are attempting to calculate a firm’s free cash flow to
equity. You know the following...
asked 1 hour ago -
the following reaction occurs in a balloon containing
N2O2 gas
N2O4(g)=2NO2(g)
will the volume of the...
asked 1 hour ago -
answer the questions throughout this program
public class Day implements Comparable {
Private Boolean atWork;...
asked 1 hour ago -
This is C++ code for parking fee management program
#include <iostream>
#include <iomanip>
using namespace std;...
asked 1 hour ago -
The free energy change for the following reaction at 25 °C, when
[Sn2+] = 1.17 M...
asked 3 hours ago -
An MNE is this kind of industry when competition in one country
is essentially independent of...
asked 5 hours ago -
. For this set of questions, determine what
proportion of a normal distribution is located betweeneach...
asked 5 hours ago -
A college student is employed as a door-to-door newspaper
salesman. Historical data suggests that the student...
asked 6 hours ago