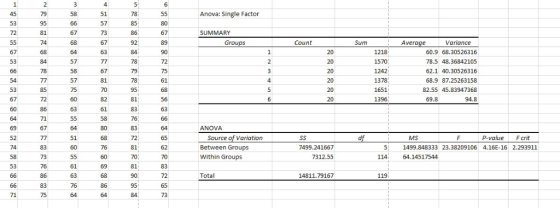
Answer Question 3 (16) (a) ANOVA output: 3 points (b) Null and alternative hypotheses in term...
answer Question 3 (16)
-
(a) ANOVA output: 3 points
-
(b) Null and alternative hypotheses in terms of the population means: 3 points Pooled estimate of the common variance: 2 points
-
Value of the test statistic: 2 points
-
Null distribution: 2 points
-
The P-value: 2 points
-
Conclusion in plain language: 2 points
the following is the data use stat crunch or excel
Category code score
C 1 45
C 1 53
C 1 72
C 1 55
C 1 67
C 1 53
C 1 66
C 1 54
C 1 53
C 1 67
C 1 60
C 1 64
C 1 69
C 1 52
C 1 74
C 1 58
C 1 53
C 1 66
C 1 66
C 1 71
H 2 79
H 2 95
H 2 81
H 2 74
H 2 68
H 2 84
H 2 78
H 2 77
H 2 85
H 2 72
H 2 86
H 2 71
H 2 67
H 2 77
H 2 83
H 2 73
H 2 76
H 2 86
H 2 83
H 2 75
Q 3 58
Q 3 66
Q 3 67
Q 3 68
Q 3 64
Q 3 57
Q 3 58
Q 3 57
Q 3 75
Q 3 60
Q 3 63
Q 3 55
Q 3 64
Q 3 51
Q 3 60
Q 3 55
Q 3 61
Q 3 63
Q 3 76
Q 3 64
T 4 51
T 4 57
T 4 73
T 4 67
T 4 63
T 4 77
T 4 67
T 4 81
T 4 70
T 4 82
T 4 61
T 4 58
T 4 80
T 4 68
T 4 76
T 4 60
T 4 69
T 4 68
T 4 86
T 4 64
HT 5 78
HT 5 85
HT 5 86
HT 5 92
HT 5 84
HT 5 78
HT 5 79
HT 5 78
HT 5 95
HT 5 81
HT 5 83
HT 5 76
HT 5 83
HT 5 72
HT 5 81
HT 5 70
HT 5 81
HT 5 90
HT 5 95
HT 5 84
QT 6 55
QT 6 80
QT 6 67
QT 6 89
QT 6 90
QT 6 72
QT 6 75
QT 6 61
QT 6 68
QT 6 56
QT 6 63
QT 6 66
QT 6 64
QT 6 65
QT 6 62
QT 6 70
QT 6 83
QT 6 72
QT 6 65
QT 6 73
Homework Answers
(a)

Add Answer to:
Answer Question 3 (16) (a) ANOVA output: 3 points (b) Null and alternative hypotheses in term...
QUESTION- Before applying any inferential tools to the data, always conduct a preliminary analysi...
 QUESTION- Before applying any inferential tools to the data,
always conduct a preliminary analysis to get an idea about the
association between your variables. In addition, the results of a
statistical analysis are valid only if the appropriate assumptions
for the model to be used are valid. The assumptions for the ANOVA
are that the data are independent and come from normal populations
with equal variances (or standard deviations). In particular:
(a) Obtain the summary statistics (sample size, mean, standard...
QUESTION- Before applying any inferential tools to the data,
always conduct a preliminary analysis to get an idea about the
association between your variables. In addition, the results of a
statistical analysis are valid only if the appropriate assumptions
for the model to be used are valid. The assumptions for the ANOVA
are that the data are independent and come from normal populations
with equal variances (or standard deviations). In particular:
(a) Obtain the summary statistics (sample size, mean, standard...
Consider the below matrixA, which you can copy and paste directly into Matlab.
Problem #1: Consider the below matrix A, which you can copy and paste directly into Matlab. The matrix contains 3 columns. The first column consists of Test #1 marks, the second column is Test # 2 marks, and the third column is final exam marks for a large linear algebra course. Each row represents a particular student.A = [36 45 75 81 59 73 77 73 73 65 72 78 65 55 83 73 57 78 84 31 60 83...
DATA: ( You will have to paste it to a text editor and format it to be entered into statcrunch - ...
 DATA: ( You will have to paste it to a text editor and format it
to be entered into statcrunch - sorry for inconvenience but I could
not find another way to post the data)
Strategy Code Score
C 1 45
C 1 53
C 1 72
C 1 55
C 1 67
C 1 53
C 1 66
C 1 54
C 1 53
C 1 67
C 1 60
C 1 64
C 1 69
C 1 52...
DATA: ( You will have to paste it to a text editor and format it
to be entered into statcrunch - sorry for inconvenience but I could
not find another way to post the data)
Strategy Code Score
C 1 45
C 1 53
C 1 72
C 1 55
C 1 67
C 1 53
C 1 66
C 1 54
C 1 53
C 1 67
C 1 60
C 1 64
C 1 69
C 1 52...
DATA DATA: ( You will have to paste it to a text editor and format it to be entered into statcru...
 DATA
DATA: ( You will have to paste it to a text editor and format it
to be entered into statcrunch - sorry for inconvenience but I could
not find another way to post the data)
Strategy Code Score
C 1 45
C 1 53
C 1 72
C 1 55
C 1 67
C 1 53
C 1 66
C 1 54
C 1 53
C 1 67
C 1 60
C 1 64
C 1 69
C 1...
DATA
DATA: ( You will have to paste it to a text editor and format it
to be entered into statcrunch - sorry for inconvenience but I could
not find another way to post the data)
Strategy Code Score
C 1 45
C 1 53
C 1 72
C 1 55
C 1 67
C 1 53
C 1 66
C 1 54
C 1 53
C 1 67
C 1 60
C 1 64
C 1 69
C 1...
Use the accompanying data set on the pulse rates (in beats per minute) of males to...
Use the accompanying data set on the pulse rates (in beats per minute) of males to complete parts (a) and (b) below. LOADING... Click the icon to view the pulse rates of males. a. Find the mean and standard deviation, and verify that the pulse rates have a distribution that is roughly normal. The mean of the pulse rates is 71.871.8 beats per minute. (Round to one decimal place as needed.) The standard deviation of the pulse rates is 12.212.2...
1. Forecast demand for Year 4. a. Explain what technique you utilized to forecast your demand....
 1. Forecast demand for Year 4.
a. Explain what technique you utilized to forecast your
demand.
b. Explain why you chose this technique over others.
Year 3 Year 1 Year 2 Actual Actual Actual Forecast Forecast Forecast Demand Demand Demand Week 1 52 57 63 55 66 77 Week 2 49 58 68 69 75 65 Week 3 47 50 58 65 80 74 Week 4 60 53 58 55 78 67 57 Week 5 49 57 64 76 77...
1. Forecast demand for Year 4.
a. Explain what technique you utilized to forecast your
demand.
b. Explain why you chose this technique over others.
Year 3 Year 1 Year 2 Actual Actual Actual Forecast Forecast Forecast Demand Demand Demand Week 1 52 57 63 55 66 77 Week 2 49 58 68 69 75 65 Week 3 47 50 58 65 80 74 Week 4 60 53 58 55 78 67 57 Week 5 49 57 64 76 77...
The given data is the grades for people in this class. The goal here is to...
 The given data is the grades for people in this class. The goal here is to determine the factors that effect student's Grade in the class. 4) Find the mean and median for the men's and the women's Quizzes. Gender Men Women 5) Test the claim that the majority of students at this class are women. F M F F M F F F F M M F F F M F F F F M M F F M...
89 67 84 74 58 51 63 68 84 65 57 76 58 75 72 67...
 89
67
84
74
58
51
63
68
84
65
57
76
58
75
72
67
64
74
95
53
77
86
90
80
70
67
76
62
91
70
63
78
49
61
77
57
83
67
107
67
80
73
94
80
73
74
67
72
68
79
73
121
63
77
70
61
75
66
79
54
76
86
84
72
65
75
63
91
72
64
99
81
58
70
58
58
90
66
64
80...
89
67
84
74
58
51
63
68
84
65
57
76
58
75
72
67
64
74
95
53
77
86
90
80
70
67
76
62
91
70
63
78
49
61
77
57
83
67
107
67
80
73
94
80
73
74
67
72
68
79
73
121
63
77
70
61
75
66
79
54
76
86
84
72
65
75
63
91
72
64
99
81
58
70
58
58
90
66
64
80...
Please compute your z -don't use a package State your conclusion in plain English - not...
 Please compute your z -don't use a package State your conclusion in plain English - not just rejection 1 Students in the online class are suspicious that their schools 60 point loss may have caused their teacher to take out his frustration on the students by giving them a harder than usual exam. They manage to hack into his computer and get the following data: Scores for test Nov 2011 71 74 64 77 58 72 73 79 50 78...
 QUESTION- Before applying any inferential tools to the data,
always conduct a preliminary analysis to get an idea about the
association between your variables. In addition, the results of a
statistical analysis are valid only if the appropriate assumptions
for the model to be used are valid. The assumptions for the ANOVA
are that the data are independent and come from normal populations
with equal variances (or standard deviations). In particular:
(a) Obtain the summary statistics (sample size, mean, standard...
QUESTION- Before applying any inferential tools to the data,
always conduct a preliminary analysis to get an idea about the
association between your variables. In addition, the results of a
statistical analysis are valid only if the appropriate assumptions
for the model to be used are valid. The assumptions for the ANOVA
are that the data are independent and come from normal populations
with equal variances (or standard deviations). In particular:
(a) Obtain the summary statistics (sample size, mean, standard...
 DATA: ( You will have to paste it to a text editor and format it
to be entered into statcrunch - sorry for inconvenience but I could
not find another way to post the data)
Strategy Code Score
C 1 45
C 1 53
C 1 72
C 1 55
C 1 67
C 1 53
C 1 66
C 1 54
C 1 53
C 1 67
C 1 60
C 1 64
C 1 69
C 1 52...
DATA: ( You will have to paste it to a text editor and format it
to be entered into statcrunch - sorry for inconvenience but I could
not find another way to post the data)
Strategy Code Score
C 1 45
C 1 53
C 1 72
C 1 55
C 1 67
C 1 53
C 1 66
C 1 54
C 1 53
C 1 67
C 1 60
C 1 64
C 1 69
C 1 52...
 DATA
DATA: ( You will have to paste it to a text editor and format it
to be entered into statcrunch - sorry for inconvenience but I could
not find another way to post the data)
Strategy Code Score
C 1 45
C 1 53
C 1 72
C 1 55
C 1 67
C 1 53
C 1 66
C 1 54
C 1 53
C 1 67
C 1 60
C 1 64
C 1 69
C 1...
DATA
DATA: ( You will have to paste it to a text editor and format it
to be entered into statcrunch - sorry for inconvenience but I could
not find another way to post the data)
Strategy Code Score
C 1 45
C 1 53
C 1 72
C 1 55
C 1 67
C 1 53
C 1 66
C 1 54
C 1 53
C 1 67
C 1 60
C 1 64
C 1 69
C 1...
 1. Forecast demand for Year 4.
a. Explain what technique you utilized to forecast your
demand.
b. Explain why you chose this technique over others.
Year 3 Year 1 Year 2 Actual Actual Actual Forecast Forecast Forecast Demand Demand Demand Week 1 52 57 63 55 66 77 Week 2 49 58 68 69 75 65 Week 3 47 50 58 65 80 74 Week 4 60 53 58 55 78 67 57 Week 5 49 57 64 76 77...
1. Forecast demand for Year 4.
a. Explain what technique you utilized to forecast your
demand.
b. Explain why you chose this technique over others.
Year 3 Year 1 Year 2 Actual Actual Actual Forecast Forecast Forecast Demand Demand Demand Week 1 52 57 63 55 66 77 Week 2 49 58 68 69 75 65 Week 3 47 50 58 65 80 74 Week 4 60 53 58 55 78 67 57 Week 5 49 57 64 76 77...
 The given data is the grades for people in this class. The goal here is to determine the factors that effect student's Grade in the class. 4) Find the mean and median for the men's and the women's Quizzes. Gender Men Women 5) Test the claim that the majority of students at this class are women. F M F F M F F F F M M F F F M F F F F M M F F M...
 89
67
84
74
58
51
63
68
84
65
57
76
58
75
72
67
64
74
95
53
77
86
90
80
70
67
76
62
91
70
63
78
49
61
77
57
83
67
107
67
80
73
94
80
73
74
67
72
68
79
73
121
63
77
70
61
75
66
79
54
76
86
84
72
65
75
63
91
72
64
99
81
58
70
58
58
90
66
64
80...
89
67
84
74
58
51
63
68
84
65
57
76
58
75
72
67
64
74
95
53
77
86
90
80
70
67
76
62
91
70
63
78
49
61
77
57
83
67
107
67
80
73
94
80
73
74
67
72
68
79
73
121
63
77
70
61
75
66
79
54
76
86
84
72
65
75
63
91
72
64
99
81
58
70
58
58
90
66
64
80...
 Please compute your z -don't use a package State your conclusion in plain English - not just rejection 1 Students in the online class are suspicious that their schools 60 point loss may have caused their teacher to take out his frustration on the students by giving them a harder than usual exam. They manage to hack into his computer and get the following data: Scores for test Nov 2011 71 74 64 77 58 72 73 79 50 78...
Most questions answered within 3 hours.
-
A magnetic dipole m(t) = m_0*cos(ωt) can be
described as current density j(r,t) = −cm(t) ×...
asked 2 minutes ago -
companies either hire outside programmers to
write_____ software or use their own internal developers.
asked 3 minutes ago -
Which food law was passed in 1996 and changed how pesticide
residues on food were regulated...
asked 3 minutes ago -
Probabilities and Counting. Yahtzee is a game that involves six
fair dice. When rolling all six...
asked 4 minutes ago -
What percent of revenue does net income represent for each
year?
Total Revenue
2017 = 60,319,000...
asked 26 minutes ago -
For Ti+2 (Z=22). Determine the correct ground state
& # of microstates. Use the correct tanabe...
asked 29 minutes ago -
Why did so many investment banks have to start buying CDO’s and
other mortgaged backed securities...
asked 44 minutes ago -
The mean cost of domestic airfares in the United States rose to
an all-time high of...
asked 55 minutes ago -
1.Magazine Luiza is a Brazilian retail chain for consumer
electronics. The company currently has 100 stores...
asked 54 minutes ago -
What is the molarity of ZnCl2 that forms when 25.0 g of zinc
completely reacts with...
asked 56 minutes ago -
For independent X and Y, we have probability density function
for them where pdf of X...
asked 1 hour ago -
The decomposition of SO2Cl2 is first order in SO2Cl2 and has a
rate constant of 1.42...
asked 1 hour ago