Business Analytics, Assignment on Clustering As part of the quarterly reviews, the manager of a r...
Business Analytics, Assignment on Clustering As part of the quarterly reviews, the manager of a retail store analyzes the quality of customer service based on the periodic customer satisfaction ratings (on a scale of 1 to 10 with 1 = Poor and 10 = Excellent). To understand the level of service quality, which includes the waiting times of the customers in the checkout section, he collected data on 100 customers who visited the store; see the attached Excel file: ServiceQuality. 1. Using Data Mining > Cluster, apply K-Means Clustering with the following Selected Variables: Wait Time (min), Purchase Amount ($), Customer Age, and Customer Satisfaction Rating. In Step 2 of the k-Means Clustering procedure, normalize (standardize) input data, assume k = 5 clusters, 50 iterations, and Fixed start with the default Centroid Initialization seed of 12345. In Step 3, select the checkboxes “Show data summary” and “Show distances from each cluster center”. a. What is the most homogenous cluster? What is the number of customers in this cluster? For this cluster, what is the average standardized Euclidean distance between its observations and its centroid (center)? What is the centroid of this cluster (expressed in standardized data)? Using the cluster centroids, how would you characterize the customers in the most homogenous cluster in comparison with the customers in the remaining clusters? b. Which two clusters are most distinct and why? Using their centroids, how would you compare the customers of the two clusters? 2. Using Data Mining > Cluster, apply Hierarchical Clustering with the following Selected Variables: Wait Time (min), Purchase Amount ($), Customer Age, and Customer Satisfaction Rating. In Step 2 of the Hierarchical Clustering procedure, normalize (standardize) input data and apply Ward’s clustering method, while in Step 3, select the checkboxes “Show dendrogram”, “Show Cluster Membership”, and assume k = 5 clusters. a. Show the obtained dendrogram. b. What are the sizes of the created clusters? c. What are the centroids of the created clusters expressed in original data. Hint: To answer Questions 2b and 2c, in the worksheet HC_Clusters, you may first add the four columns with original data, and sort the column Cluster by clicking Data in the Ribbon and selecting . Then you can easily find the cluster sizes, and the four variable averages characterizing each cluster. 3. Based on your findings, what reasons do you see for low customer satisfaction ratings? Provide some recommendations for improving customer satisfaction. Write a managerial report in MS Word; do not attach any separate Data Mining and/or Excel outputs. Instead paste into your report the Data Mining outputs with answers to Questions in Tasks 1 and 2a, and Excel results related to Tasks 2b and 2c. Showing these outputs/results is crucial because without them I will not be able to verify your answers. Note 1. The use of other software is unacceptable! Note 2. To better prepare for the assignment, study the clustering example KTC in the slides, and the questions on Exhibit 4.4 in Test Bank.
Homework Answers

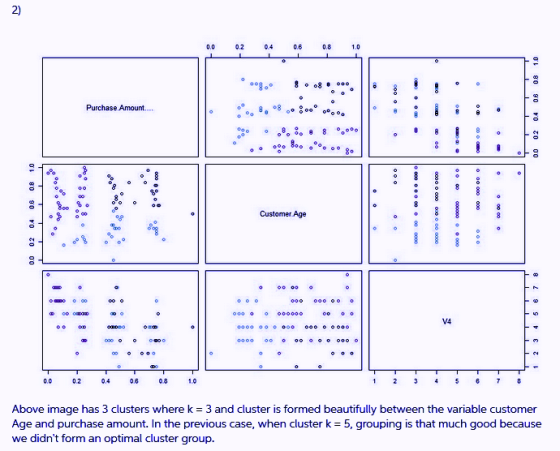
![within cluster sum of squares by cluster: [1] 11.374864 2.635716 4.056018 2.268045 3.209352 (between-SS / total-SS 91.0 %) -](http://img.homeworklib.com/images/cac4bd33-18b0-4fcb-8a47-997b38b88800.png?x-oss-process=image/resize,w_560)


Add Answer to:
Business Analytics, Assignment on Clustering As part of the quarterly reviews, the manager of a r...
Hierarchical clustering is sometimes used to generate K clusters, K > 1 by taking the clusters...
Hierarchical clustering is sometimes used to generate K clusters, K > 1 by taking the clusters at the Kth level of the dendrogram. (Root is at level 1.) By looking at the clusters produced in this way, we can evaluate the behavior of hierarchical clustering on different types of data and clusters, and also compare hierarchical approaches to K-means. The following is a set of one-dimensional points: {6, 12, 18, 24, 30, 42, 48}. (a) For each of the following...
Most questions answered within 3 hours.
-
A gas tank is a vertical cylinder. It has a radius of 1m, a
height of...
asked 22 minutes ago -
Accent Software faces the following conditions. All of these
support Accent’s use of a market-penetration pricing...
asked 1 hour ago -
A mathematically inclined friend emails you the following
instructions: "Meet me in the cafeteria the first...
asked 1 hour ago -
A monopoly sells in two countries . The demand curves in the two
countries are p1...
asked 2 hours ago -
A .15kg rubber ball is bounced off a wall. Before hitting the
wall, the ball moves...
asked 2 hours ago -
A manufacturing company preparing to build a new plant is
considering three potential locations for it....
asked 3 hours ago -
B. If compound Y has approximately the same values of solubility
in toluene as compound X,...
asked 3 hours ago -
Oscar Inc. has inventory in Japan valued at 39,051,000 Yen one
year ago. One year ago...
asked 3 hours ago -
If Canada suffered from "fundamental disequilibrium," and its
government choose not to devalue its currency, a...
asked 4 hours ago -
4. How many input & output Key Value Pairs are passed into,
and emitted out of...
asked 3 hours ago -
Why would your heart not function well if constructed of
skeletal muscle? What is the particular...
asked 4 hours ago -
Please respond to this essay question in full essay form for
Chemistry 1102 Organic and Biochemistry:...
asked 4 hours ago