Please use Excel and Post all those answers here, if you're not going to use Excel then don't ans...
Homework Answers
| Frequency | Table | |
| Xi | XiPi | XiBi |
| 1 | 23.197 | 46 |
| 2 | 46.744 | 96 |
| 3 | 61.362 | 120 |
| 4 | 94.364 | 160 |
| 5 | 133.255 | 230 |
| 6 | 164.718 | 222 |
| 7 | 120.862 | 224 |
| 8 | 144.168 | 232 |
| 9 | 258.147 | 342 |
| 10 | 308.72 | 430 |
| 11 | 215.457 | 352 |
| 12 | 278.028 | 564 |
| 13 | 466.063 | 728 |
| 14 | 269.514 | 588 |
| 15 | 300.705 | 420 |
| 16 | 388.56 | 896 |
| 17 | 413.508 | 850 |
| 18 | 442.962 | 558 |
| 19 | 544.73 | 969 |
| 20 | 310.92 | 520 |
| 21 | 334.635 | 525 |
| 22 | 437.206 | 990 |
| 23 | 580.773 | 1288 |
| 24 | 606.648 | 1128 |
| 25 | 700.85 | 950 |
| 26 | 637.858 | 1326 |
| 27 | 740.961 | 1053 |
| 28 | 556.892 | 1232 |
| 29 | 580.116 | 1334 |
| 30 | 520.71 | 840 |
| 31 | 624.805 | 1023 |
| 32 | 630.016 | 1120 |
| 33 | 780.681 | 1155 |
| 34 | 904.842 | 1428 |
| 35 | 731.325 | 1225 |
| 36 | 727.308 | 1296 |
| 37 | 879.305 | 1776 |
| 38 | 979.754 | 2014 |
| 39 | 1039.779 | 1794 |
| 40 | 1291.08 | 2200 |
| 41 | 846.322 | 1599 |
| 42 | 923.202 | 1806 |
| 43 | 1034.236 | 2408 |
| 44 | 1135.156 | 1936 |
| 45 | 710.73 | 1350 |
| 46 | 840.098 | 1794 |
| 47 | 1688.475 | 2491 |
| 48 | 835.152 | 1392 |
| 49 | 880.432 | 1470 |
| 50 | 1017.8 | 2200 |
| 51 | 1093.542 | 2091 |
| 52 | 1129.544 | 2132 |
| 53 | 1024.543 | 1855 |
| 54 | 1232.118 | 2754 |
| 55 | 1087.13 | 2420 |
| 56 | 1155.448 | 2856 |
| 57 | 1194.834 | 2793 |
| 58 | 1325.01 | 2378 |
| 59 | 1550.815 | 2596 |
| 60 | 1673.76 | 2220 |
| 61 | 1773.636 | 2562 |
| 62 | 2014.504 | 3162 |
| 63 | 1190.07 | 1953 |
| 64 | 1391.36 | 2496 |
| 65 | 1454.31 | 3445 |
| 66 | 1621.686 | 3630 |
| 67 | 1705.083 | 2680 |
| 68 | 1926.916 | 3128 |
| 69 | 1424.298 | 2415 |
| 70 | 1652.91 | 3290 |
| 71 | 1719.62 | 4118 |
| 72 | 2207.16 | 3672 |
| 73 | 1638.266 | 2993 |
| 74 | 1323.934 | 2442 |
| 75 | 1561.35 | 3450 |
| 76 | 1994.012 | 3572 |
| 77 | 1574.265 | 2618 |
| 78 | 1681.368 | 3354 |
| 79 | 1709.481 | 2923 |
| 80 | 1943.68 | 3760 |
![Histogram Price and Age 100% 90% 80% 70% 60% 50% 28 13 30% 20% 10% 0% (22.546, 26.046] [15.546, 19.046] (33.046, 36.546] (19.](http://img.homeworklib.com/images/a96fd0b8-b572-4ed9-963f-48d8d3684c8e.png?x-oss-process=image/resize,w_560)
#Descriptive Statistics
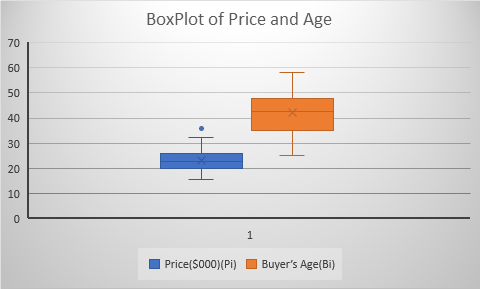
| Descriptive Statistics | Price($000)(Pi) | Buyer’s Age(Bi) |
| Mean | 23.2181625 | 42.15 |
| Variance | 18.96112864 | 67.52151899 |
| Standerd Deviation | 4.35443781 | 8.217147862 |
| Median | 22.831 | 42.5 |
| Mode | 20.642 | 46 |
| 1st Quartile | 15.546 | 35.75 |
| 3rd Quartile | 25.787 | 47.25 |
| Min | 15.546 | 25 |
| Max | 35.925 | 58 |
| lower limit | 14.68346439 | 26.04439019 |
| upper limit | 31.75286061 | 58.25560981 |
Add Answer to:
Please use Excel and Post all those answers here, if you're not going to use Excel then don't ans...
Solve all parts and show working: (i) : Use a 5% significance level to test the...
 Solve all parts and show working:
(i) :
Use a 5% significance level to test the claim that the
unsuccessful applicants are from a population with a greater mean
age than the mean age of successful applicants. Based on the
result, does there appear to be discrimination based on age? What
did you use to get the answer?
(ii): Is it a parametric or non-parametric test? If it
is a parametric test what is distribution of test
statistic
The Revenue...
Solve all parts and show working:
(i) :
Use a 5% significance level to test the claim that the
unsuccessful applicants are from a population with a greater mean
age than the mean age of successful applicants. Based on the
result, does there appear to be discrimination based on age? What
did you use to get the answer?
(ii): Is it a parametric or non-parametric test? If it
is a parametric test what is distribution of test
statistic
The Revenue...
NUMBER OF PEOPLE 10.2 10.0 10.1 8.5 10.2 8.2 8 Source: United States Census. 11. In...
 NUMBER OF PEOPLE 10.2 10.0 10.1 8.5 10.2 8.2 8 Source: United States Census. 11. In the Sanitary District of Chicago, operating engineers are hired on of a competitive civil-service examination. In 1966, there were 223 appl for 15 jobs. The exam was held on March 12; the test scores are s arranged in increasing order. The height of each bar in the histogram next page) shows the number of people with the correspondin examiners were charged with rigging the...
Do the Academy Awards involve discrimination based on age? Listed below are the ages of actresses...
Do the Academy Awards involve discrimination based on age? Listed below are the ages of actresses and actors at the times that they won Oscars in the Best Actress and Best Actor categories. the ages are listed in order, beginning with the first Academy Awards ceremony in 1928. (Note: in 1968 there was a tie in the Best Actress category, and the mean of the two ages is used; in 1932 there was a tie in the Best Actor category,...
The accompanying computer excel output (please see attachment on Blackboard) provides details of data and analysis...
 The accompanying computer excel output
(please see attachment on Blackboard) provides details of data and
analysis on the topic of “patient satisfaction”. A hospital
administrator wished to study the relation between patient
satisfaction (Y) and patients’ age (X1, in years) , severity of
illness (X2), and anxiety level (X3).
The output includes a listing of all
46 observations; descriptive statistics for each variable; and, the
results of a regression analysis that uses patient satisfaction as
the dependent variable, and patient’s...
The accompanying computer excel output
(please see attachment on Blackboard) provides details of data and
analysis on the topic of “patient satisfaction”. A hospital
administrator wished to study the relation between patient
satisfaction (Y) and patients’ age (X1, in years) , severity of
illness (X2), and anxiety level (X3).
The output includes a listing of all
46 observations; descriptive statistics for each variable; and, the
results of a regression analysis that uses patient satisfaction as
the dependent variable, and patient’s...
Use the accompanying data set to complete the following actions. a. Find the quartiles. b. Find...
 Use the accompanying data set to complete the following actions. a. Find the quartiles. b. Find the interquartile range. c. Identify any outliers. 41 53 37 44 40 36 39 47 43 39 34 56 42 36 15 51 39 50 29 29 0 a. Find the quartiles. The first quartile, Q7, is The second quartile, Q2, is The third quartile, Q3, is (Type integers or decimals.) b. Find the interquartile range. The interquartile range (IQR) is (Type an integer...
For the following data, construct a frequency distribution with six classes. 57 23 35 18 35...
For the following data, construct a frequency distribution with six classes. 57 23 35 18 35 26 51 47 29 21 46 43 29 23 39 29 41 19 36 28 31 42 41 29 18 28 46 33 28 20 Class Interval Frequencies 16 - under 23 enter a frequency 23 - under 30 enter a frequency 30 - under 37 enter a frequency 37 - under 44 enter a frequency 44 - under 51 enter a frequency 51...
Please help Use the accompanying data set to complete the following actions. a. Find the quartiles....
 Please help
Use the accompanying data set to complete the following actions. a. Find the quartiles. b. Find the interquartile range. c. Identify any outliers. 40 52 37 43 41 38 41 46 43 37 35 56 43 34 15 53 37 51 30 30 a. Find the quartiles. The first quartile, Q7, is The second quartile, Q2, is The third quartile, Q3, is (Type integers or decimals.) b. Find the interquartile range. The interquartile range (IQR) is (Type an...
Please help
Use the accompanying data set to complete the following actions. a. Find the quartiles. b. Find the interquartile range. c. Identify any outliers. 40 52 37 43 41 38 41 46 43 37 35 56 43 34 15 53 37 51 30 30 a. Find the quartiles. The first quartile, Q7, is The second quartile, Q2, is The third quartile, Q3, is (Type integers or decimals.) b. Find the interquartile range. The interquartile range (IQR) is (Type an...
(a). Construct a frequency distribution with the suitable class interval size of marks obtained by 50...
(a). Construct a frequency distribution with the suitable class interval size of marks obtained by 50 students of a class, which are given below: 23, 50, 38, 42, 63, 75, 12, 33, 26, 39, 35, 47, 43, 52, 56, 59, 64, 77, 15, 21, 51, 54, 72, 68, 36, 65, 52, 60, 27, 34, 47, 48, 55, 58, 59, 62, 51, 48, 50, 41, 57, 65, 54, 43, 56, 44, 30, 46, 67, 53 (b). Find the Minimum Value (c)....
Sample Data Sample Data Hour Sample Taken Hour Sample Taken 1 4 5 X 1 3...
 Sample Data Sample Data Hour Sample Taken Hour Sample Taken 1 4 5 X 1 3 1 42 2 3 4 5 6 2 39 36 25 60 28 53 22 56 41 34 43 45 59 42 36 40 45 39 48 26 42 34 61 48 45 29 3 31 61 38 40 54 26 38 42 37 41 53 37 47 41 37 29 20 26 43 38 33 37 37 35 33 36 41 25 37...
Inferences from Two Samples chapter Listed below are the ages of actresses the awards ceremony, b...
 Inferences from Two Samples chapter Listed below are the ages of actresses the awards ceremony, but the ages in and actors at the times that they won the table below are based on the birth Oscars for the categories of Best Actress date of the winner and the date of the and Best Actor. The ages aze listed in awards certmony) chronological otder by row, so that cor- responding locations in the two tables Analyzing the Results are from the...
 Solve all parts and show working:
(i) :
Use a 5% significance level to test the claim that the
unsuccessful applicants are from a population with a greater mean
age than the mean age of successful applicants. Based on the
result, does there appear to be discrimination based on age? What
did you use to get the answer?
(ii): Is it a parametric or non-parametric test? If it
is a parametric test what is distribution of test
statistic
The Revenue...
Solve all parts and show working:
(i) :
Use a 5% significance level to test the claim that the
unsuccessful applicants are from a population with a greater mean
age than the mean age of successful applicants. Based on the
result, does there appear to be discrimination based on age? What
did you use to get the answer?
(ii): Is it a parametric or non-parametric test? If it
is a parametric test what is distribution of test
statistic
The Revenue...
 NUMBER OF PEOPLE 10.2 10.0 10.1 8.5 10.2 8.2 8 Source: United States Census. 11. In the Sanitary District of Chicago, operating engineers are hired on of a competitive civil-service examination. In 1966, there were 223 appl for 15 jobs. The exam was held on March 12; the test scores are s arranged in increasing order. The height of each bar in the histogram next page) shows the number of people with the correspondin examiners were charged with rigging the...
 The accompanying computer excel output
(please see attachment on Blackboard) provides details of data and
analysis on the topic of “patient satisfaction”. A hospital
administrator wished to study the relation between patient
satisfaction (Y) and patients’ age (X1, in years) , severity of
illness (X2), and anxiety level (X3).
The output includes a listing of all
46 observations; descriptive statistics for each variable; and, the
results of a regression analysis that uses patient satisfaction as
the dependent variable, and patient’s...
The accompanying computer excel output
(please see attachment on Blackboard) provides details of data and
analysis on the topic of “patient satisfaction”. A hospital
administrator wished to study the relation between patient
satisfaction (Y) and patients’ age (X1, in years) , severity of
illness (X2), and anxiety level (X3).
The output includes a listing of all
46 observations; descriptive statistics for each variable; and, the
results of a regression analysis that uses patient satisfaction as
the dependent variable, and patient’s...
 Use the accompanying data set to complete the following actions. a. Find the quartiles. b. Find the interquartile range. c. Identify any outliers. 41 53 37 44 40 36 39 47 43 39 34 56 42 36 15 51 39 50 29 29 0 a. Find the quartiles. The first quartile, Q7, is The second quartile, Q2, is The third quartile, Q3, is (Type integers or decimals.) b. Find the interquartile range. The interquartile range (IQR) is (Type an integer...
 Please help
Use the accompanying data set to complete the following actions. a. Find the quartiles. b. Find the interquartile range. c. Identify any outliers. 40 52 37 43 41 38 41 46 43 37 35 56 43 34 15 53 37 51 30 30 a. Find the quartiles. The first quartile, Q7, is The second quartile, Q2, is The third quartile, Q3, is (Type integers or decimals.) b. Find the interquartile range. The interquartile range (IQR) is (Type an...
Please help
Use the accompanying data set to complete the following actions. a. Find the quartiles. b. Find the interquartile range. c. Identify any outliers. 40 52 37 43 41 38 41 46 43 37 35 56 43 34 15 53 37 51 30 30 a. Find the quartiles. The first quartile, Q7, is The second quartile, Q2, is The third quartile, Q3, is (Type integers or decimals.) b. Find the interquartile range. The interquartile range (IQR) is (Type an...
 Sample Data Sample Data Hour Sample Taken Hour Sample Taken 1 4 5 X 1 3 1 42 2 3 4 5 6 2 39 36 25 60 28 53 22 56 41 34 43 45 59 42 36 40 45 39 48 26 42 34 61 48 45 29 3 31 61 38 40 54 26 38 42 37 41 53 37 47 41 37 29 20 26 43 38 33 37 37 35 33 36 41 25 37...
 Inferences from Two Samples chapter Listed below are the ages of actresses the awards ceremony, but the ages in and actors at the times that they won the table below are based on the birth Oscars for the categories of Best Actress date of the winner and the date of the and Best Actor. The ages aze listed in awards certmony) chronological otder by row, so that cor- responding locations in the two tables Analyzing the Results are from the...
Most questions answered within 3 hours.
-
26) Briefly describe, using words or simple diagrams, the
chemiosmotic theory for coupling oxidation to phosphorylation...
asked 9 minutes ago -
Suppose that XX is a random variable with mean 16 and standard
deviation 5 . Also...
asked 1 hour ago -
Calculate the number density of argon gas at a temperature of
24C and a pressure of...
asked 4 hours ago -
Alternative
Classification
How to Estimate
Probabilities from Data? ( For continuous Attributes)
And How to generate...
asked 4 hours ago -
An explosion breaks a 20.0-kg object into three parts. The
object is initially moving at a...
asked 5 hours ago -
Calculate the approximate number of residues of Rubisco, which
is involved in carbon fixation in plants,...
asked 6 hours ago -
Other decisions about scientific claims can have a much broader
impact.ENERGYarrow-10x10.png, environment, health, security - all...
asked 7 hours ago -
I need to write a research paper and work cited about this
topic: The United States...
asked 7 hours ago -
Hello! I was wondering if I could have some help?
If the vapor pressure of carvone...
asked 7 hours ago -
An economist wants to estimate the mean per capita income (in
thousands of dollars) for a...
asked 8 hours ago -
What would be the input/output characteristic of a circuit
obtained by putting two of your 2's-complementers...
asked 8 hours ago -
In Drosophila, the transition from the syncytial blastoderm
stage to the cellular blastoderm stage is a...
asked 8 hours ago