1. A researcher is investigating the health of some plants that have been treated with a chemical to increase their rate of growth. In the problems below, data is given about levels of two different elements in the plants. The data for each element show the levels of the element in the treated plants, and the levels of the element in untreated plants.
A.) The nitrogen levels of the treated and untreated plants are given in parts per million in the chart below.

b. State the null hypothesis about nitrogen for the experiment.
c. Compare the results for the control group and the treatment group. Do you think that the researcher has enough evidence to reject the null hypothesis?
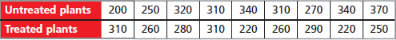
D. The potassium levels of the treated and untreated plants are given in parts per million in the chart below.
e. State the null hypothesis about potassium for the experiment.
f. Compare the results for the control group and the treatment group. Do you think that the researcher has enough evidence to reject the null hypothesis?
Untreated plants Treated plants 200 250 320 310 340 310 270 340 370 310 260 280 310 220 260290 220 250
Homework Answers
a) , b) and c)
| Untreated | treated |
| 140 | 120 |
| 100 | 180 |
| 120 | 130 |
| 110 | 150 |
| 130 | 220 |
| 100 | 150 |
| 130 | 170 |
| 150 | 160 |
| 120 | 130 |


| t-Test: Two-Sample Assuming Equal Variances | ||
| Untreated | treated | |
| Mean | 122.2222222 | 156.6666667 |
| Variance | 294.4444444 | 950 |
| Observations | 9 | 9 |
| Pooled Variance | 622.2222222 | |
| Hypothesized Mean Difference | 0 | |
| df | 16 | |
| t Stat | -2.929224666 | |
| P(T<=t) one-tail | 0.004913031 | |
| t Critical one-tail | 1.745883676 | |
| P(T<=t) two-tail | 0.009826061 | |
| t Critical two-tail | 2.119905299 | |
p-value = 0.0098 < alpha
hence we reject the null hypothesis
we conclude that the researcher has enough evidence to reject the null hypothesis
d) ,e) and f)
data
| Untreated | treated |
| 200 | 310 |
| 250 | 260 |
| 320 | 280 |
| 310 | 310 |
| 340 | 220 |
| 310 | 260 |
| 270 | 290 |
| 340 | 220 |
| 370 | 250 |
| t-Test: Two-Sample Assuming Equal Variances | ||
| Untreated | treated | |
| Mean | 301.1111111 | 266.6666667 |
| Variance | 2761.111111 | 1150 |
| Observations | 9 | 9 |
| Pooled Variance | 1955.555556 | |
| Hypothesized Mean Difference | 0 | |
| df | 16 | |
| t Stat | 1.652305552 | |
| P(T<=t) one-tail | 0.058978919 | |
| t Critical one-tail | 1.745883676 | |
| P(T<=t) two-tail | 0.117957838 | |
| t Critical two-tail | 2.119905299 | |
p-value =0.1180 > alpha
we conclude that the researcher has not enough evidence to reject the null hypothesis
Add Answer to:
1. A researcher is investigating the health of some plants that have been treated with a chemical...
20 30 40 50 60 70 80 99 100 110 120 130 140 150 160 170...
 20 30 40 50 60 70 80 99 100 110 120 130 140 150 160 170 180 190 259 260 270 280 290 300 310 320 330 340 350 360 370 380 390 400 410 420 430 490 500 51 52 53 545 QUESTION 47 Ben bought a house for $500,000. The bank will make a mortgage loan with 10% down, 30 years at 3% annual interest rate with monthly payments. What will be Ben's monthly payment? $1,250.00 $1,388.89 O...
Transits - Application Complete the task correctly on first attempt. Failure to perform will be rewarded...
 Transits - Application Complete the task correctly on first attempt. Failure to perform will be rewarded with -2 points per unsuccessful attempt. Star Light Curve 100.01 100.00 99.99 99.98 99.97 3 99.96 99.95 99.94 99.93 99.92 99.91 2 99.90 99.89 99.88 99.87 99.86 99.85 0 10 20 30 40 50 60 70 80 90 100 110 120 130 140 150 160 170 180 190 200 210 220 230 240 250 260 270 280 290 300 310 320 330 340 350...
The table below presents the annual market for sofas in Akron, Ohio. Suppose the state government...
 The table below presents the annual market for sofas in Akron,
Ohio. Suppose the state government imposes a $200 excise tax on
every sofa sold to be paid by customers at the point of sale.
Market for Sofas Price (dollars) $1,240 1,180 ї,120 1,060 1,000 940 880 820 760 700 Quantity of Sofas Demanded 190 220 250 280 310 340 370 400 430 460 Quantity of Sofas Supplied 290 270 250 230 210 190 170 150 130 110 Quantity of...
The table below presents the annual market for sofas in Akron,
Ohio. Suppose the state government imposes a $200 excise tax on
every sofa sold to be paid by customers at the point of sale.
Market for Sofas Price (dollars) $1,240 1,180 ї,120 1,060 1,000 940 880 820 760 700 Quantity of Sofas Demanded 190 220 250 280 310 340 370 400 430 460 Quantity of Sofas Supplied 290 270 250 230 210 190 170 150 130 110 Quantity of...
please type it do not handwritten Data were collected on the prices of parts at each...
 please type it do not handwritten
Data were collected on the prices of parts at each shelf in auto parts showroom in Melbourne. The prices of parts at each shelf, are given below. 50 60 550 100 160 60 30 230 120 140 100 20 53 130 190 120 300 10 100 120 140 140430 230 240 250 120 170 200 250 400 139 180 200 260 320 630 200 140 530 450 170150190 300 250 140 270 280 290...
please type it do not handwritten
Data were collected on the prices of parts at each shelf in auto parts showroom in Melbourne. The prices of parts at each shelf, are given below. 50 60 550 100 160 60 30 230 120 140 100 20 53 130 190 120 300 10 100 120 140 140430 230 240 250 120 170 200 250 400 139 180 200 260 320 630 200 140 530 450 170150190 300 250 140 270 280 290...
Open the data Cars04-HW6&5 and answer questions 13 to 14. 13. Compute the Average, Median, and...
Open the data Cars04-HW6&5 and answer questions 13 to 14. 13. Compute the Average, Median, and Standard Deviation Horsepower column. Which of the following statement is true? (4 points) a. Median < Average < Standard deviation b. Average < Standard deviation c. Standard deviation d. Average < Median < Standard deviation e. Standard Deviation < Average < Median 14. Using 2-standard deviation rule of thumb and the information you obtained from question 13 which of the following is true? Round...
Baeyer Villiger Can someone explain the GCMS of this sample? This was the procedure: A solution...
 Baeyer Villiger
Can someone explain the GCMS of this sample?
This was the procedure:
A solution of acetophenone, 20 mmoles, and
metha-chloroperbenzoic acid (mCPBA)
36mmoles, are stirred in 50mL of distilled water at 80°C for 4 h
and monitored by
TLC (eluent: ethyl acetate). The reaction mixture is cooled to
room temperature and
extracted with dichloromethane (3x30mL). The combined organic
layers are
washed with saturated NaHCO3, and NaCl brine solution. The
solution is then dried
with MgSO4 and the solvent...
Baeyer Villiger
Can someone explain the GCMS of this sample?
This was the procedure:
A solution of acetophenone, 20 mmoles, and
metha-chloroperbenzoic acid (mCPBA)
36mmoles, are stirred in 50mL of distilled water at 80°C for 4 h
and monitored by
TLC (eluent: ethyl acetate). The reaction mixture is cooled to
room temperature and
extracted with dichloromethane (3x30mL). The combined organic
layers are
washed with saturated NaHCO3, and NaCl brine solution. The
solution is then dried
with MgSO4 and the solvent...
2. A chemical factory is located next to a farm. Airborne emissions from the chemical fac...
 2. A chemical factory is located next to a farm. Airborne emissions from the chemical fac tory damage crops on the farm. The marginal benefits of emissions to the factory and the marginal costs of damage to the farmer are as follows: Quantity of emissions Marginal benefit to factory (S000) 320 280 240 200 160 120 80 40 0 Marginal cost to farmer ($000) 110 130 150 170 190 210 230 250 270 From an economic point of view, what...
For each exercise, assume that all variables are normally distributed, that the samples are independent, and...
 For each exercise, assume that all variables are normally distributed, that the samples are independent, and that the population variances are equal. Also, for each exercise, perform the following steps: 1. State the hypotheses and identify the claim; 2. Find the critical value; 3. Compute the test value; 4. Make the decision to reject or not reject the null hypothesis; 5. Summarize the result. 2) Sodium Contents of Foods The amount of sodium (in milligrams) in one serving for a...
Hi there. I am super confused and thought that this molecule was a cinnamyl ester as...
 Hi there. I am super confused and thought that this molecule was
a cinnamyl ester as shown here.
This does not seem to match up with the mass spectroscopy, but
it does seem to match with NMR. Can someone please teach me what I
am missing? I've included all data below.
i
just need to identify what molecule this is because the molecular
weight does not match. Thanks!
он O0 6 ppm 7.5 7.0 6.5 6.0 5.5 5.0 4.5 4.0...
Hi there. I am super confused and thought that this molecule was
a cinnamyl ester as shown here.
This does not seem to match up with the mass spectroscopy, but
it does seem to match with NMR. Can someone please teach me what I
am missing? I've included all data below.
i
just need to identify what molecule this is because the molecular
weight does not match. Thanks!
он O0 6 ppm 7.5 7.0 6.5 6.0 5.5 5.0 4.5 4.0...
There are four McWendy King restaurants in the city of Burgerville; one in the metropolitan area,...
There are four McWendy King restaurants in the city of Burgerville; one in the metropolitan area, one at the market plaza, one at Burger University, and one at the river. To compare the mean sales of burgers at the four restaurants, six weeks were randomly selected, and the number of burgers sold were recorded. Assume that weekly sales of burgers at the four restaurants are normally at each restaurant distributed. RESTAURANT : Metro; Market plaza; University; River Week 1 130...
 20 30 40 50 60 70 80 99 100 110 120 130 140 150 160 170 180 190 259 260 270 280 290 300 310 320 330 340 350 360 370 380 390 400 410 420 430 490 500 51 52 53 545 QUESTION 47 Ben bought a house for $500,000. The bank will make a mortgage loan with 10% down, 30 years at 3% annual interest rate with monthly payments. What will be Ben's monthly payment? $1,250.00 $1,388.89 O...
 Transits - Application Complete the task correctly on first attempt. Failure to perform will be rewarded with -2 points per unsuccessful attempt. Star Light Curve 100.01 100.00 99.99 99.98 99.97 3 99.96 99.95 99.94 99.93 99.92 99.91 2 99.90 99.89 99.88 99.87 99.86 99.85 0 10 20 30 40 50 60 70 80 90 100 110 120 130 140 150 160 170 180 190 200 210 220 230 240 250 260 270 280 290 300 310 320 330 340 350...
 The table below presents the annual market for sofas in Akron,
Ohio. Suppose the state government imposes a $200 excise tax on
every sofa sold to be paid by customers at the point of sale.
Market for Sofas Price (dollars) $1,240 1,180 ї,120 1,060 1,000 940 880 820 760 700 Quantity of Sofas Demanded 190 220 250 280 310 340 370 400 430 460 Quantity of Sofas Supplied 290 270 250 230 210 190 170 150 130 110 Quantity of...
The table below presents the annual market for sofas in Akron,
Ohio. Suppose the state government imposes a $200 excise tax on
every sofa sold to be paid by customers at the point of sale.
Market for Sofas Price (dollars) $1,240 1,180 ї,120 1,060 1,000 940 880 820 760 700 Quantity of Sofas Demanded 190 220 250 280 310 340 370 400 430 460 Quantity of Sofas Supplied 290 270 250 230 210 190 170 150 130 110 Quantity of...
 please type it do not handwritten
Data were collected on the prices of parts at each shelf in auto parts showroom in Melbourne. The prices of parts at each shelf, are given below. 50 60 550 100 160 60 30 230 120 140 100 20 53 130 190 120 300 10 100 120 140 140430 230 240 250 120 170 200 250 400 139 180 200 260 320 630 200 140 530 450 170150190 300 250 140 270 280 290...
please type it do not handwritten
Data were collected on the prices of parts at each shelf in auto parts showroom in Melbourne. The prices of parts at each shelf, are given below. 50 60 550 100 160 60 30 230 120 140 100 20 53 130 190 120 300 10 100 120 140 140430 230 240 250 120 170 200 250 400 139 180 200 260 320 630 200 140 530 450 170150190 300 250 140 270 280 290...
 Baeyer Villiger
Can someone explain the GCMS of this sample?
This was the procedure:
A solution of acetophenone, 20 mmoles, and
metha-chloroperbenzoic acid (mCPBA)
36mmoles, are stirred in 50mL of distilled water at 80°C for 4 h
and monitored by
TLC (eluent: ethyl acetate). The reaction mixture is cooled to
room temperature and
extracted with dichloromethane (3x30mL). The combined organic
layers are
washed with saturated NaHCO3, and NaCl brine solution. The
solution is then dried
with MgSO4 and the solvent...
Baeyer Villiger
Can someone explain the GCMS of this sample?
This was the procedure:
A solution of acetophenone, 20 mmoles, and
metha-chloroperbenzoic acid (mCPBA)
36mmoles, are stirred in 50mL of distilled water at 80°C for 4 h
and monitored by
TLC (eluent: ethyl acetate). The reaction mixture is cooled to
room temperature and
extracted with dichloromethane (3x30mL). The combined organic
layers are
washed with saturated NaHCO3, and NaCl brine solution. The
solution is then dried
with MgSO4 and the solvent...
 2. A chemical factory is located next to a farm. Airborne emissions from the chemical fac tory damage crops on the farm. The marginal benefits of emissions to the factory and the marginal costs of damage to the farmer are as follows: Quantity of emissions Marginal benefit to factory (S000) 320 280 240 200 160 120 80 40 0 Marginal cost to farmer ($000) 110 130 150 170 190 210 230 250 270 From an economic point of view, what...
 For each exercise, assume that all variables are normally distributed, that the samples are independent, and that the population variances are equal. Also, for each exercise, perform the following steps: 1. State the hypotheses and identify the claim; 2. Find the critical value; 3. Compute the test value; 4. Make the decision to reject or not reject the null hypothesis; 5. Summarize the result. 2) Sodium Contents of Foods The amount of sodium (in milligrams) in one serving for a...
 Hi there. I am super confused and thought that this molecule was
a cinnamyl ester as shown here.
This does not seem to match up with the mass spectroscopy, but
it does seem to match with NMR. Can someone please teach me what I
am missing? I've included all data below.
i
just need to identify what molecule this is because the molecular
weight does not match. Thanks!
он O0 6 ppm 7.5 7.0 6.5 6.0 5.5 5.0 4.5 4.0...
Hi there. I am super confused and thought that this molecule was
a cinnamyl ester as shown here.
This does not seem to match up with the mass spectroscopy, but
it does seem to match with NMR. Can someone please teach me what I
am missing? I've included all data below.
i
just need to identify what molecule this is because the molecular
weight does not match. Thanks!
он O0 6 ppm 7.5 7.0 6.5 6.0 5.5 5.0 4.5 4.0...
Most questions answered within 3 hours.
-
the following reaction occurs in a balloon containing
N2O2 gas
N2O4(g)=2NO2(g)
will the volume of the...
asked 30 minutes ago -
answer the questions throughout this program
public class Day implements Comparable {
Private Boolean atWork;...
asked 37 minutes ago -
This is C++ code for parking fee management program
#include <iostream>
#include <iomanip>
using namespace std;...
asked 48 minutes ago -
The free energy change for the following reaction at 25 °C, when
[Sn2+] = 1.17 M...
asked 2 hours ago -
An MNE is this kind of industry when competition in one country
is essentially independent of...
asked 4 hours ago -
. For this set of questions, determine what
proportion of a normal distribution is located betweeneach...
asked 4 hours ago -
A college student is employed as a door-to-door newspaper
salesman. Historical data suggests that the student...
asked 5 hours ago -
MATLAB HW 11 problem using Switch Case and Input commands
Write a script file that calculates...
asked 5 hours ago -
Considering gravitational time dilation, calculate the time that
passes in Earth’s surface while 1 hour passes...
asked 5 hours ago -
Minitab Problem: Take the Lake Hume June rainfall data and find
use the processes outlined in...
asked 6 hours ago -
X Company is trying to decide whether to continue using old
equipment to make Product A...
asked 6 hours ago -
IN PYTHON ONLY !! Program 2: Re-work
program #5 (WeeklyHours) from the previous assignment such that...
asked 7 hours ago