Write a MATLAB function cobweb that plots a cobweb diagram to visualise the iterations per- forme...
Write a MATLAB function cobweb that plots a cobweb
diagram to visualise the iterations per-
formed by an iterative method of the form
xn+1 = g(xn).
the cobweb function should take as its inputs a function handle g
of a function that implements
g, an initial estimate x0, the number of iterations to perform
numits, values xmin, xmax, ymin
and ymax, and a one dimensional array ud. The function g may be
undefined or discontinuous
at a finite number of points between xmin and xmax. The first entry
of ud will contain the
number of points between xmin and xmax at which g is undefined or
discontinuous. The
remaining entries of ud will contain these points in increasing
order. The function should
plot y = x in red and y = g(x) in blue. The horizontal axis should
be labelled x and the
vertical axis should be labelled y. A legend which identifies y=x
and y=g(x) should be on
your plot. The axes should then be adjusted so that the horizontal
axis goes from xmin to
xmax and the vertical axis goes from ymin to ymax. Henceforth, the
range of the axes and
the legend should not change. Your cobweb function should then plot
vertical and horizontal
lines in black to visualise the iterations performed by the
iterative method
xn+1 = g(xn).
Before plotting each horizontal and vertical line your function
should wait for 1 second. The
function should not print anything in the command window.
Homework Answers
function cobweb(g,x0,numits,xmin,xmax,ymin,ymax,ud)
figure
x = x0;
for i=1:numits
safe = false;
if isempty(ud)||numel(ud)<2||ud(1)==0
safe = true;
else
% checking x in ud
num_ud = ud(1);
values_ud = ud(2:end);
for j = 1:num_ud
if isempty(find(values_ud==x))
safe = true;
end
end
end
if safe % x is not in ud
plot(x,x, 'o r') % plotting y = x
hold on
plot(x,g(x),'o b') % plotting y = g(x)
% getting new x
x = g(x);
hold on
else % x is in ud
% try getting out of discontinuity by incrementing x slightly
x = x+0.001;
end
hold on
end
legend('y = x','y = g(x)','location','best')
xlim([xmin xmax])
ylim([ymin ymax])
xlabel('x')
ylabel('y')
% showing iterations atarting from initial value of x
x = x0;
hold on
for i=1:numits
safe = false;
if isempty(ud)||numel(ud)<2||ud(1)==0
safe = true;
else
% checking x in ud
num_ud = ud(1);
values_ud = ud(2:end);
for j = 1:num_ud
if isempty(find(values_ud==x))
safe = true;
end
end
end
if safe
plot( [x x], [x g(x)], 'k') % plotting vertical line
pause(1)
hold on
plot( [x g(x)], [g(x) g(x)], 'k') %plotting horizontal line
x = g(x);
hold on
else
% try getting out of discontinuity by incrementing x slightly
x = x+0.001;
end
end
hold off
end
----------------------------------------------------------------
%driver file
close all
clc
clear
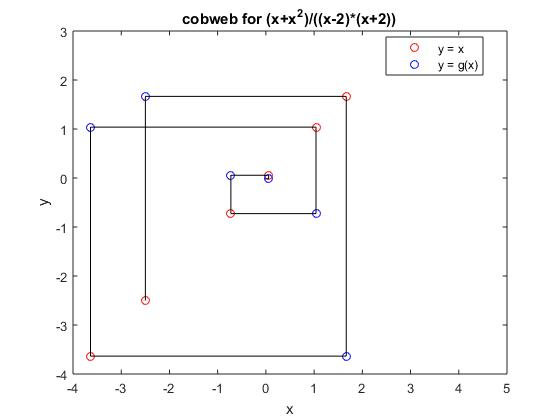
g = @(x) (x+x.^2)./((x-2).*(x+2));
%g = @(x) cos(x)
x0 = -2.5;
numits = 6;
xmin = -4; xmax = 5;
ymin = -4 ; ymax = 3;
ud = [2,-2,2]; % 2 discontinuties at x = -2 and at x = 2
cobweb(g,x0,numits,xmin,xmax,ymin,ymax,ud)
title('cobweb for (x+x^2)/((x-2)*(x+2))')
%}
%{
% getting cobweb for another function
g = @(x) cos(x);
x0 = 0;
numits = 10;
xmin = 0; xmax = 1;
ymin = 0.4 ; ymax = 1;
ud = [];
%figure
cobweb(g,x0,numits,xmin,xmax,ymin,ymax,ud)
title('cobweb for cos(x)')
%}

COMMENT DOWN FOR ANY QUERY RELATED TO THIS ANSWER,
IF YOU'RE SATISFIED, GIVE A THUMBS UP
Add Answer to:
Write a MATLAB function cobweb that plots a cobweb diagram to visualise the iterations per- forme...
1) Create a matlab function that calculates: for Name your function TwoVarFunc : The inputs should...
 1) Create a matlab function that calculates:
for
Name your function TwoVarFunc :
The inputs should be in the same order:
xmin
xmax
ymin
ymax
N: n is the number of elements in the vector x and y
The ouputs should be in the same order:
f_xy: is the calculated array f(x,y)
f_xyMAX: should be the the maximum value of the function
f(x,y).
Hint: to create vectors x and y look up the matlab built-in
function linspace()
Hint 2: To...
1) Create a matlab function that calculates:
for
Name your function TwoVarFunc :
The inputs should be in the same order:
xmin
xmax
ymin
ymax
N: n is the number of elements in the vector x and y
The ouputs should be in the same order:
f_xy: is the calculated array f(x,y)
f_xyMAX: should be the the maximum value of the function
f(x,y).
Hint: to create vectors x and y look up the matlab built-in
function linspace()
Hint 2: To...
Task 2: (1 Mark) - Scripts Write a MATLAB script which plots the absolute error between...
 Task 2: (1 Mark) - Scripts Write a MATLAB script which plots the absolute error between your mySqrt() function and the built-in sqrt() function for a variety of N values with: N=1:20 • n=323158 err-le-3. Your plot should clearly show that error decreases until "saturating" somewhere below err. Because the algorithm "converges” (increased in accuracy) very quickly the true accuracy will be several orders of magnitude better than the err value. You should use semilogy () instead of plot() to...
II. Using Newton’s method, write a MATLAB program to find the fixed point of the following...
II. Using Newton’s method, write a MATLAB program to find the fixed point of the following function: ?(?) = √? + ?? accurate to at least 8 decimal places. (HINT: finding the fixed point of f(x) is the same as finding the zero of g(x) = f(x) − x. ) The output of this program should display in a single table (i) the solution for the fixed point, (ii) the initial guess, (iii) the number of iterations it took to...
% MATLAB allows root loci to be plotted with the % rlocus(GH) command, where G(s)H(s) =...
 % MATLAB allows root loci to be plotted with the
% rlocus(GH) command, where G(s)H(s) = numgh/dengh and GH is an
LTI transfer-
% function object. Points on the root locus can be selected
interactively
% using [K,p] = rlocfind(GH) command. MATLAB yields gain(K)
at
% that point as well as all other poles(p) that have that gain.
We can zoom
% in and out of root locus by changing range of axis values
using
% command axis([xmin,xmax,ymin,ymax]). root locus...
% MATLAB allows root loci to be plotted with the
% rlocus(GH) command, where G(s)H(s) = numgh/dengh and GH is an
LTI transfer-
% function object. Points on the root locus can be selected
interactively
% using [K,p] = rlocfind(GH) command. MATLAB yields gain(K)
at
% that point as well as all other poles(p) that have that gain.
We can zoom
% in and out of root locus by changing range of axis values
using
% command axis([xmin,xmax,ymin,ymax]). root locus...
Newton's Method in MATLAB During this module, we are going to use Newton's method to compute...
 Newton's Method in MATLAB During this module, we are going to use Newton's method to compute the root(s) of the function f(x) = x° + 3x² – 2x – 4 Since we need an initial approximation ('guess') of each root to use in Newton's method, let's plot the function f(x) to see many roots there are, and approximately where they lie. Exercise 1 Use MATLAB to create a plot of the function f(x) that clearly shows the locations of its...
% PA 08: 3D Plots, Files, Functions % Using the script provided and the functions provided,...
 % PA 08: 3D Plots, Files, Functions
% Using the script provided and the functions provided,
complete the code
% to be able to plot specified graphs. Script file contains a
menu of
% choices where user will select which plot to produce.
% Functions contain the necessary code to plot. Please note
that functions
% do NOT take any arguments and do NOT return anything.
% You are provided with two MS Excel files that you must use
to...
% PA 08: 3D Plots, Files, Functions
% Using the script provided and the functions provided,
complete the code
% to be able to plot specified graphs. Script file contains a
menu of
% choices where user will select which plot to produce.
% Functions contain the necessary code to plot. Please note
that functions
% do NOT take any arguments and do NOT return anything.
% You are provided with two MS Excel files that you must use
to...
For this project, each part will be in its oun matlab script. You will be uploading a total 3 m f...
 For this project, each part will be in its oun matlab script. You will be uploading a total 3 m files. Be sure to make your variable names descriptive, and add comments regularly to describe what your code is doing and hou your code aligns with the assignment 1 Iterative Methods: Conjugate Gradient In most software applications, row reduction is rarely used to solve a linear system Ar-b instead, an iterative algorithm like the one presented below is used. 1.1...
QUESTIONS 13-18 PLEASE! Maximum Storage Area DUE DATE: This project is worth 10% of your Unit...
 QUESTIONS 13-18 PLEASE!
Maximum Storage Area DUE DATE: This project is worth 10% of your Unit 2 grade. Please review the Project FAQ handout for format and process. Problem Situation A construction company wishes to build a rectangular enclosure to store machinery and equipment. The site selected borders on a river that will be used as one of the sides of the rectangle. Fencing will be needed to form the other three sides. The company foot high chain-link fencing. The...
QUESTIONS 13-18 PLEASE!
Maximum Storage Area DUE DATE: This project is worth 10% of your Unit 2 grade. Please review the Project FAQ handout for format and process. Problem Situation A construction company wishes to build a rectangular enclosure to store machinery and equipment. The site selected borders on a river that will be used as one of the sides of the rectangle. Fencing will be needed to form the other three sides. The company foot high chain-link fencing. The...
Before you start For this homework, we will need to import some libraries. You need to...
Before you start For this homework, we will need to import some libraries. You need to execute the following cell only once; you don't need to copy this in every cell you run. In [ ]: import pandas import numpy from urllib.request import urlretrieve from matplotlib import pyplot %matplotlib inline #This library is needed for testing from IPython.display import set_matplotlib_close set_matplotlib_close(False) Introduction In this homework, you will work with data from the World Bank. The subject of study is...
In cell C6, insert a Scatter Chart for the Returns Completed versus Return Price data from...
 In
cell C6, insert a Scatter Chart for the Returns
Completed versus Return Price data from the Data
worksheet. You may be used to seeing Price placed on the Y-axis
from other economics courses, but in this problem we are using
price as the independent variable.
Inserting Chart
Select the Scatter chart from the provided chart options in the
Charts group of the Insert tab of the Ribbon.
Selecting Data Series
Then choose Select Data in the Design tab on...
In
cell C6, insert a Scatter Chart for the Returns
Completed versus Return Price data from the Data
worksheet. You may be used to seeing Price placed on the Y-axis
from other economics courses, but in this problem we are using
price as the independent variable.
Inserting Chart
Select the Scatter chart from the provided chart options in the
Charts group of the Insert tab of the Ribbon.
Selecting Data Series
Then choose Select Data in the Design tab on...
 1) Create a matlab function that calculates:
for
Name your function TwoVarFunc :
The inputs should be in the same order:
xmin
xmax
ymin
ymax
N: n is the number of elements in the vector x and y
The ouputs should be in the same order:
f_xy: is the calculated array f(x,y)
f_xyMAX: should be the the maximum value of the function
f(x,y).
Hint: to create vectors x and y look up the matlab built-in
function linspace()
Hint 2: To...
1) Create a matlab function that calculates:
for
Name your function TwoVarFunc :
The inputs should be in the same order:
xmin
xmax
ymin
ymax
N: n is the number of elements in the vector x and y
The ouputs should be in the same order:
f_xy: is the calculated array f(x,y)
f_xyMAX: should be the the maximum value of the function
f(x,y).
Hint: to create vectors x and y look up the matlab built-in
function linspace()
Hint 2: To...
 Task 2: (1 Mark) - Scripts Write a MATLAB script which plots the absolute error between your mySqrt() function and the built-in sqrt() function for a variety of N values with: N=1:20 • n=323158 err-le-3. Your plot should clearly show that error decreases until "saturating" somewhere below err. Because the algorithm "converges” (increased in accuracy) very quickly the true accuracy will be several orders of magnitude better than the err value. You should use semilogy () instead of plot() to...
 % MATLAB allows root loci to be plotted with the
% rlocus(GH) command, where G(s)H(s) = numgh/dengh and GH is an
LTI transfer-
% function object. Points on the root locus can be selected
interactively
% using [K,p] = rlocfind(GH) command. MATLAB yields gain(K)
at
% that point as well as all other poles(p) that have that gain.
We can zoom
% in and out of root locus by changing range of axis values
using
% command axis([xmin,xmax,ymin,ymax]). root locus...
% MATLAB allows root loci to be plotted with the
% rlocus(GH) command, where G(s)H(s) = numgh/dengh and GH is an
LTI transfer-
% function object. Points on the root locus can be selected
interactively
% using [K,p] = rlocfind(GH) command. MATLAB yields gain(K)
at
% that point as well as all other poles(p) that have that gain.
We can zoom
% in and out of root locus by changing range of axis values
using
% command axis([xmin,xmax,ymin,ymax]). root locus...
 Newton's Method in MATLAB During this module, we are going to use Newton's method to compute the root(s) of the function f(x) = x° + 3x² – 2x – 4 Since we need an initial approximation ('guess') of each root to use in Newton's method, let's plot the function f(x) to see many roots there are, and approximately where they lie. Exercise 1 Use MATLAB to create a plot of the function f(x) that clearly shows the locations of its...
 % PA 08: 3D Plots, Files, Functions
% Using the script provided and the functions provided,
complete the code
% to be able to plot specified graphs. Script file contains a
menu of
% choices where user will select which plot to produce.
% Functions contain the necessary code to plot. Please note
that functions
% do NOT take any arguments and do NOT return anything.
% You are provided with two MS Excel files that you must use
to...
% PA 08: 3D Plots, Files, Functions
% Using the script provided and the functions provided,
complete the code
% to be able to plot specified graphs. Script file contains a
menu of
% choices where user will select which plot to produce.
% Functions contain the necessary code to plot. Please note
that functions
% do NOT take any arguments and do NOT return anything.
% You are provided with two MS Excel files that you must use
to...
 For this project, each part will be in its oun matlab script. You will be uploading a total 3 m files. Be sure to make your variable names descriptive, and add comments regularly to describe what your code is doing and hou your code aligns with the assignment 1 Iterative Methods: Conjugate Gradient In most software applications, row reduction is rarely used to solve a linear system Ar-b instead, an iterative algorithm like the one presented below is used. 1.1...
 QUESTIONS 13-18 PLEASE!
Maximum Storage Area DUE DATE: This project is worth 10% of your Unit 2 grade. Please review the Project FAQ handout for format and process. Problem Situation A construction company wishes to build a rectangular enclosure to store machinery and equipment. The site selected borders on a river that will be used as one of the sides of the rectangle. Fencing will be needed to form the other three sides. The company foot high chain-link fencing. The...
QUESTIONS 13-18 PLEASE!
Maximum Storage Area DUE DATE: This project is worth 10% of your Unit 2 grade. Please review the Project FAQ handout for format and process. Problem Situation A construction company wishes to build a rectangular enclosure to store machinery and equipment. The site selected borders on a river that will be used as one of the sides of the rectangle. Fencing will be needed to form the other three sides. The company foot high chain-link fencing. The...
 In
cell C6, insert a Scatter Chart for the Returns
Completed versus Return Price data from the Data
worksheet. You may be used to seeing Price placed on the Y-axis
from other economics courses, but in this problem we are using
price as the independent variable.
Inserting Chart
Select the Scatter chart from the provided chart options in the
Charts group of the Insert tab of the Ribbon.
Selecting Data Series
Then choose Select Data in the Design tab on...
In
cell C6, insert a Scatter Chart for the Returns
Completed versus Return Price data from the Data
worksheet. You may be used to seeing Price placed on the Y-axis
from other economics courses, but in this problem we are using
price as the independent variable.
Inserting Chart
Select the Scatter chart from the provided chart options in the
Charts group of the Insert tab of the Ribbon.
Selecting Data Series
Then choose Select Data in the Design tab on...
Most questions answered within 3 hours.
-
A steel wire in a piano has a length of 0.680 m and a mass of...
asked 25 minutes ago -
Is validity and reliability tested by the following methods of
data analysis:
The questionnaires were coded...
asked 1 hour ago -
whats the relationship between toxoids and clostridium tetani and
botulinum?
asked 1 hour ago -
1)Explain what it means when demand is inelastic?
2) If demand is elastic, total revenue will...
asked 1 hour ago -
Jose is making quarterly contributions of of $210 to his savings
account which pays interest at...
asked 1 hour ago -
Rachel is pushing a box across the floor while Jon, at the same
time, is hoping...
asked 1 hour ago -
According to the Situational Leadership Model, which of the
following development levels works with a supporting...
asked 1 hour ago -
The Acme Trucking company has hired you to write software to
help dispatch its trucks. One...
asked 1 hour ago -
Write a script that uses four separate for loops to output the
following:
1 2 3...
asked 1 hour ago -
An instructor who taught two sections of engineering statistics
last term, the first with 20 students...
asked 2 hours ago -
A class consists of 15 boys and 12 girls. They want to elect
officers so that...
asked 1 hour ago -
The mean number of words per minute (WPM) typed by a speed
typist is 79 with...
asked 1 hour ago