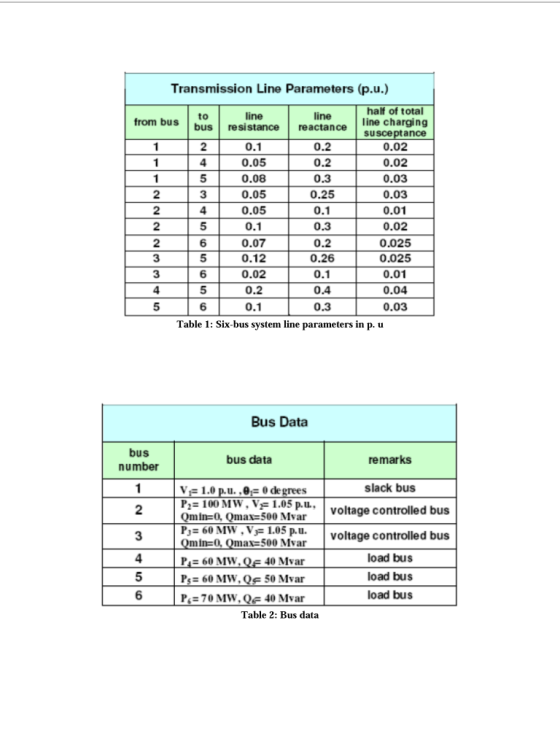

Transmission Line Parameters (p.u.) half of total line charging line from busto ubus resistance reactance 0.1 0.05 0.08 0.05 0.05 0.1 0.07 0.12 0.02 0.2 0.1 suscepta ance 0.2 0.2 0.3 0.25 0.1 0.3 0.2 0.26 0.1 0.4 0.3 0.02 0.02 0.03 0.03 0.01 0.02 0.025 0.025 0.01 0.04 0.03 4 2 6 3 3 5 6 Table 1: Six-bus system line parameters in p. u Bus Data bus number bus data remarks slack bus VF 1.0 р.u. .9F 0 degrees P,-100 MW . VF 1.05 р.u." Omin-o, Qma-500 Mva voltage controlled bus P 6 MW, V 1.05 p.l. votage controlled bus 11 0, Qi ax=500 Mvar P60 MW Ps= 60 MW, QF 50 Mvar P 70 MW,Q6 40 Mvar load bus load bus load bus 40 Mva Table 2: Bus data
2 of 3 5. Assume that load forecast analysis predicts an increase in the power demanded in the next five years, in order to meet these demands a new generator rated 420 MW is installed at bus 3 to bring the total bus generation to 480 MW. Modify your program to calculate power flow in the future. Do all bus voltages fall within the allowable limits? One way to regulate bus voltages is to install shunt capacitor banks. Place 20 Mvar shunt capacitor bank on the "needed" bus to regulate its voltage and study its effect. 6. Bonus: If line 3-6 is dropped due to disturbance, analyze its impact on the system (i.e. bus voltages and transmission line loading). If all transmission lines have a maximum MVA rating of 60 MVA, list all transmission lines that violate its operating limit. If any bus voltage is not within the desired limits, how can you correct this'? Ps.V, Ps.Q 6 B.4 P. Q Figure 1: Six-bus system
Homework Answers
For forming the Admittance Matrix of given Power System network as:


So now, the Admittance Matrix can be written as :

NOTE: As you haven't mentioned any specific question among all for which you want the answer, so following the HOMEWORKLIB RULES, I am answering only 1st question.
Add Answer to:
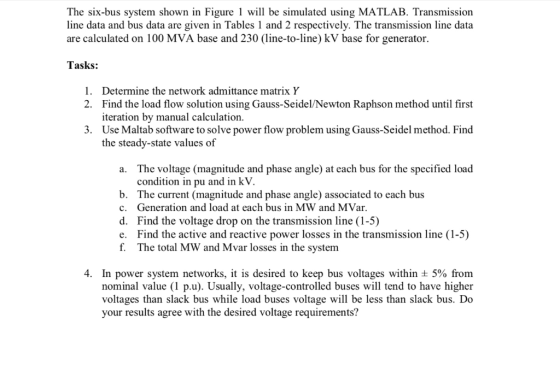
The six-bus system shown in Figure 1 will be simulated using MATLAB. Transmission line data and b...
Consider the single line diagram of a 3-bus power system shown in Figure 2. Slack bus...
 Consider the single line diagram of a 3-bus power system shown in Figure 2. Slack bus 3 Figure 2. The data for this system are given in Tables 1 and 2. Bus Table 1 Generation Load Assumed PG QGPLQL bus voltage (MW) (MVar) (MW) (MVar) 1.05 +10.0 - - 1.0 + 0.0 50 30 305.6 140.2 1.0 +0.0 0.0 0.0 138.6 45.2 slack bus) Table 2 Bus-to-bus Impedance 0.2 + j0.04 .01 +0.03 2.3 0.0125 + j0.025 (0) Convert all...
1. In the power system network shown in Figure 1, Vi bus 1 is a slack bus with 1.00 per unit and bus 2 is a load bus wi...
 1. In the power system network shown in Figure 1, Vi bus 1 is a slack bus with 1.00 per unit and bus 2 is a load bus with S2 Mvar. The line impedance on a base of 100 MVA is Z = 0.02 + j0.04 per unit (a) Using Gauss-Seidel method, determine V2 . Use an initial estimate of V=1.0j0.0 and perform four iterations (b) If after several iterations voltage at bus 2 converges to V2 = 0.90-j0.10, determine...
The single line diagram of a power network is shown in the figure. Bus#1 is a slack bus. The sche...
 Answer part D
The single line diagram of a power network is shown in the figure. Bus#1 is a slack bus. The scheduled powers for bus#2 and bus#3 are given. The impedances shown in the figure are all in per-unit considering a power base of 100 MVA. 30 400 MW 320 MVAr Slack V-140 j0.0125 jo.0s 00 MW 270 MVAr A. Use the Gauss Seidel technique to determine voltages at bus#2 & bus#3. (Start with an initial guess 140 for...
Answer part D
The single line diagram of a power network is shown in the figure. Bus#1 is a slack bus. The scheduled powers for bus#2 and bus#3 are given. The impedances shown in the figure are all in per-unit considering a power base of 100 MVA. 30 400 MW 320 MVAr Slack V-140 j0.0125 jo.0s 00 MW 270 MVAr A. Use the Gauss Seidel technique to determine voltages at bus#2 & bus#3. (Start with an initial guess 140 for...
The single line diagram of a power network is shown in the figure. Bus#1 is a slack bus. The sche...
 The single line diagram of a power network is shown in the figure. Bus#1 is a slack bus. The scheduled powers for bus#2 and bus#3 are given. The impedances shown in the figure are all in per-unit considering a power base of 100 MVA. 30 400 MW 320 MVAr Slack V-1400.0125 jo.os 3 300 MW 270 MVAr A. Use the Gauss Seidel technique to determine voltages at bus#2 & bus#3. (Start with an initial guess 140 for both buses). [Only...
Figure 1 shows the one line diagram of a simple power system. Generators are connected at...
 Figure 1 shows the one line diagram of a simple power system. Generators are connected at buses 1 and 3 while the loads are indicated at all five buses. Base values for transmission system are 100 MVA, 138 kV. The line data of Table 1 gives per unit series impedances and the charging MVar accounting for the distributed capacitance of the 5 lines. The bus data in Table 2 list values for P, Q and Vat each bus. The slack...
Q2. i) The one-line diagram of simple three-bus power system with generation at bus 1 is shown in figure Q2. 0.02 + 30.04 2 256.6 MW 0.0125 + 30.025 +110.2 Mvar 0.01 + 30.03 Slack Bus 3 Vi = 1.0520° 138.6 MW 45.2 Mvar Figure Q2 The magnitude of voltage at
Q2. i) The one-line diagram of simple three-bus power system with generation at bus 1 is shown in figure Q2. 0.02 + 30.04 2 256.6 MW 0.0125 + 30.025 +110.2 Mvar 0.01 + 30.03 Slack Bus 3 Vi = 1.0520° 138.6 MW 45.2 Mvar Figure Q2 The magnitude of voltage at bus 1 is adjusted to 1.05 per unit. The scheduled loads at buses 2 and 3 are as marked on the diagram. Line impedances are marked in per unit...
Question 1: A single line diagram of a three-bus power system is shown in Fig 1....
 Question 1: A single line diagram of a three-bus power system is shown in Fig 1. Bus 1 is the slack bus with a voltage of 1.020 per unit, bus 2 is a voltage-controlled bus (PV-bus) with a voltage magnitude of 1.05 pu and real generated power of 1 00 MWand the reactive power in the range Q.(20MVAR) < Q<Q-60M¥AR .BUS 3 is PQ bus with P 300 MW and Q= 200 Mvar. Take 100 MVÅ susceptance are neglected as...
This is 5 bus ssystem white full answer I will like your a Figure 1 shows the one line diagram of...
 this is 5 bus ssystem white full answer I will like your
a
Figure 1 shows the one line diagram of a simple power system.
Generators are connected at buses 1 and 3 while the loads are
indicated at all five buses. Base values for transmission system
are 100 MVA, 138 kV. The line data of Table 1 gives per unit series
impedances and the charging MVar accounting for the distributed
capacitance of the 5 lines. The bus data in...
this is 5 bus ssystem white full answer I will like your
a
Figure 1 shows the one line diagram of a simple power system.
Generators are connected at buses 1 and 3 while the loads are
indicated at all five buses. Base values for transmission system
are 100 MVA, 138 kV. The line data of Table 1 gives per unit series
impedances and the charging MVar accounting for the distributed
capacitance of the 5 lines. The bus data in...
(POWER SYSTEM ANALYSIS) Load + Load Figure 1. One line diagram of a three bus power...
 (POWER SYSTEM ANALYSIS) Load + Load Figure 1. One line diagram of a three bus power transmission system. In Figure 1, the power flows in the transmission lines are to be found. In this system, 100 MVA and 154 kV are the base values. The generator bus, which is shown as Bus 1, is considered to be an infinite bus and the voltage magnitude and the angle are 1 and 0°, respectively. The voltages of Bus 2 and Bus 3...
2. In the two-bus system shown in Figure 59, bus l is a slack bus with...
 2. In the two-bus system shown in Figure 59, bus l is a slack bus with Vi = 1.0/0° pu. A load of 100 MW and 50 Mvar is taken from bus 2. The line impedance is zi2 0.12 + j0.16 pu on a base of 100 MVA. Using Newton-Raphson method. obtain the voltage magnitude and phase angle of bus 2. Start with an initial estimate of | ½|(0) = 1 .0 pu and δ2(0) = 0°. Perform two terations....
 Consider the single line diagram of a 3-bus power system shown in Figure 2. Slack bus 3 Figure 2. The data for this system are given in Tables 1 and 2. Bus Table 1 Generation Load Assumed PG QGPLQL bus voltage (MW) (MVar) (MW) (MVar) 1.05 +10.0 - - 1.0 + 0.0 50 30 305.6 140.2 1.0 +0.0 0.0 0.0 138.6 45.2 slack bus) Table 2 Bus-to-bus Impedance 0.2 + j0.04 .01 +0.03 2.3 0.0125 + j0.025 (0) Convert all...
 1. In the power system network shown in Figure 1, Vi bus 1 is a slack bus with 1.00 per unit and bus 2 is a load bus with S2 Mvar. The line impedance on a base of 100 MVA is Z = 0.02 + j0.04 per unit (a) Using Gauss-Seidel method, determine V2 . Use an initial estimate of V=1.0j0.0 and perform four iterations (b) If after several iterations voltage at bus 2 converges to V2 = 0.90-j0.10, determine...
 Answer part D
The single line diagram of a power network is shown in the figure. Bus#1 is a slack bus. The scheduled powers for bus#2 and bus#3 are given. The impedances shown in the figure are all in per-unit considering a power base of 100 MVA. 30 400 MW 320 MVAr Slack V-140 j0.0125 jo.0s 00 MW 270 MVAr A. Use the Gauss Seidel technique to determine voltages at bus#2 & bus#3. (Start with an initial guess 140 for...
Answer part D
The single line diagram of a power network is shown in the figure. Bus#1 is a slack bus. The scheduled powers for bus#2 and bus#3 are given. The impedances shown in the figure are all in per-unit considering a power base of 100 MVA. 30 400 MW 320 MVAr Slack V-140 j0.0125 jo.0s 00 MW 270 MVAr A. Use the Gauss Seidel technique to determine voltages at bus#2 & bus#3. (Start with an initial guess 140 for...
 The single line diagram of a power network is shown in the figure. Bus#1 is a slack bus. The scheduled powers for bus#2 and bus#3 are given. The impedances shown in the figure are all in per-unit considering a power base of 100 MVA. 30 400 MW 320 MVAr Slack V-1400.0125 jo.os 3 300 MW 270 MVAr A. Use the Gauss Seidel technique to determine voltages at bus#2 & bus#3. (Start with an initial guess 140 for both buses). [Only...
 Figure 1 shows the one line diagram of a simple power system. Generators are connected at buses 1 and 3 while the loads are indicated at all five buses. Base values for transmission system are 100 MVA, 138 kV. The line data of Table 1 gives per unit series impedances and the charging MVar accounting for the distributed capacitance of the 5 lines. The bus data in Table 2 list values for P, Q and Vat each bus. The slack...
 Question 1: A single line diagram of a three-bus power system is shown in Fig 1. Bus 1 is the slack bus with a voltage of 1.020 per unit, bus 2 is a voltage-controlled bus (PV-bus) with a voltage magnitude of 1.05 pu and real generated power of 1 00 MWand the reactive power in the range Q.(20MVAR) < Q<Q-60M¥AR .BUS 3 is PQ bus with P 300 MW and Q= 200 Mvar. Take 100 MVÅ susceptance are neglected as...
 this is 5 bus ssystem white full answer I will like your
a
Figure 1 shows the one line diagram of a simple power system.
Generators are connected at buses 1 and 3 while the loads are
indicated at all five buses. Base values for transmission system
are 100 MVA, 138 kV. The line data of Table 1 gives per unit series
impedances and the charging MVar accounting for the distributed
capacitance of the 5 lines. The bus data in...
this is 5 bus ssystem white full answer I will like your
a
Figure 1 shows the one line diagram of a simple power system.
Generators are connected at buses 1 and 3 while the loads are
indicated at all five buses. Base values for transmission system
are 100 MVA, 138 kV. The line data of Table 1 gives per unit series
impedances and the charging MVar accounting for the distributed
capacitance of the 5 lines. The bus data in...
 (POWER SYSTEM ANALYSIS) Load + Load Figure 1. One line diagram of a three bus power transmission system. In Figure 1, the power flows in the transmission lines are to be found. In this system, 100 MVA and 154 kV are the base values. The generator bus, which is shown as Bus 1, is considered to be an infinite bus and the voltage magnitude and the angle are 1 and 0°, respectively. The voltages of Bus 2 and Bus 3...
 2. In the two-bus system shown in Figure 59, bus l is a slack bus with Vi = 1.0/0° pu. A load of 100 MW and 50 Mvar is taken from bus 2. The line impedance is zi2 0.12 + j0.16 pu on a base of 100 MVA. Using Newton-Raphson method. obtain the voltage magnitude and phase angle of bus 2. Start with an initial estimate of | ½|(0) = 1 .0 pu and δ2(0) = 0°. Perform two terations....
Most questions answered within 3 hours.
-
What is the molecular shape and the electronic geometry of CCl3,
H3O, CO3, and SO2?
asked 57 seconds ago -
Consider a value to be significantly low if its z score less
than or equal to...
asked 5 minutes ago -
Consider the reaction:
SO2Cl2(g)⇌SO2(g)+Cl2(g) Kp=2.91×10³ at 298 K
In a reaction at equilibrium, the partial pressure...
asked 6 minutes ago -
QUESTION 17
The wavelength of blue light is comparable to the size of
A.
At atomic...
asked 8 minutes ago -
Ball 1, with a mass of 120 g and traveling at 11 m/s , collides
head...
asked 12 minutes ago -
This question is about calculating and printing
payslips. User inputs his name, number of worked hours...
asked 13 minutes ago -
What is an interaction style and what is its role in effective
interface design? List and...
asked 21 minutes ago -
EXPLAIN HOW THIS PROGRAM WORKS, USING DEV C++
#include <iostream>
#include <cmath>
#define PI 3.1415926535897
using...
asked 33 minutes ago -
In the method below, add code to return the index of the element
in array that...
asked 46 minutes ago -
If Inventory is sold FOB destination, the title transfers from
seller to buyer:
A.when the goods...
asked 44 minutes ago -
Imagine that you’ve been asked to explain one of the major
accounting ratios to a group...
asked 46 minutes ago -
The vapor pressure of liquid propyl amine, C3H7NH2, is 100. mm
Hg at 274 K. A...
asked 1 hour ago