this is 5 bus ssystem white full answer I will like your
a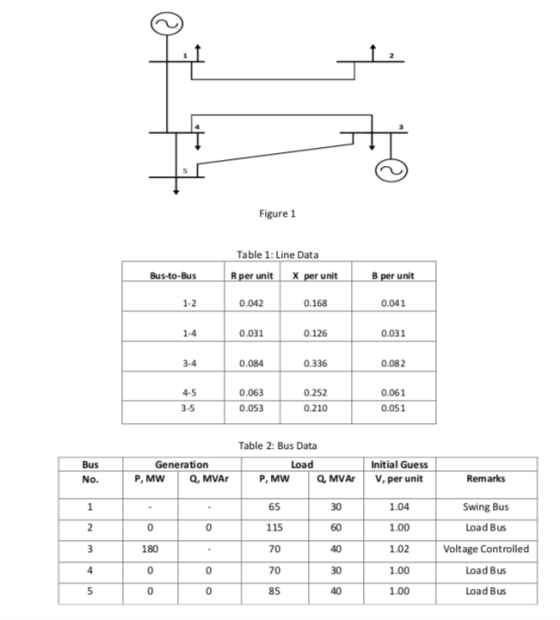
Figure 1 shows the one line diagram of a simple power system. Generators are connected at buses 1 and 3 while the loads are indicated at all five buses. Base values for transmission system are 100 MVA, 138 kV. The line data of Table 1 gives per unit series impedances and the charging MVar accounting for the distributed capacitance of the 5 lines. The bus data in Table 2 list values for P, Q and V at each bus. The slack bus (bus1) voltage magnitude and angle, and also voltage magnitude at bus 3 (since it is a PV bus) are kept constant at the values listed also the generated Q is not mentioned for them.
Part I
1. Find the power flow solution using Gauss-Seidel/Newton Raphson method until first
iteration by manual calculation. Show all your work.
write full answer this is a five bus system I will like the answer
Homework Answers


Add Answer to:
This is 5 bus ssystem white full answer I will like your a Figure 1 shows the one line diagram of...
Figure 1 shows the one line diagram of a simple power system. Generators are connected at...
 Figure 1 shows the one line diagram of a simple power system. Generators are connected at buses 1 and 3 while the loads are indicated at all five buses. Base values for transmission system are 100 MVA, 138 kV. The line data of Table 1 gives per unit series impedances and the charging MVar accounting for the distributed capacitance of the 5 lines. The bus data in Table 2 list values for P, Q and Vat each bus. The slack...
Consider the single line diagram of a 3-bus power system shown in Figure 2. Slack bus...
 Consider the single line diagram of a 3-bus power system shown in Figure 2. Slack bus 3 Figure 2. The data for this system are given in Tables 1 and 2. Bus Table 1 Generation Load Assumed PG QGPLQL bus voltage (MW) (MVar) (MW) (MVar) 1.05 +10.0 - - 1.0 + 0.0 50 30 305.6 140.2 1.0 +0.0 0.0 0.0 138.6 45.2 slack bus) Table 2 Bus-to-bus Impedance 0.2 + j0.04 .01 +0.03 2.3 0.0125 + j0.025 (0) Convert all...
The six-bus system shown in Figure 1 will be simulated using MATLAB. Transmission line data and b...
 The six-bus system shown in Figure 1 will be simulated using MATLAB. Transmission line data and bus data are given in Tables 1 and 2 respectively. The transmission line data are calculated on 100 MVA base and 230 (line-to-line) kV base for generator. Tasks: 1. Determine the network admittance matrix Y 2. Find the load flow solution using Gauss-Seidel/Newton Raphson method until first iteration by manual calculation. Use Maltab software to solve power flow problem using Gauss-Seidel method. Find the...
3. Figure 3, shows the one-line diagram of a simple three-bus power system with generation at buses 1 and 3. The voltag...
 Figure 3, shows the one-line diagram of a simple three-bus power system with generation at buses 1 and 3 . The voltage at bus 1 is \(V_{1}=1.025 \angle 0^{\circ}\) per unit. Voltage magnitude at bus 3 is fixed at \(1.03\) pu with a real power generation of \(300 \mathrm{MW}\). A load consisting of \(400 \mathrm{MW}\) and \(200 \mathrm{Mvar}\) is taken from bus 2. Line impedances are marked in per unit on a 100-MVA base. For the purpose of hand calculations,...
Q2. i) The one-line diagram of simple three-bus power system with generation at bus 1 is shown in figure Q2. 0.02 + 30.04 2 256.6 MW 0.0125 + 30.025 +110.2 Mvar 0.01 + 30.03 Slack Bus 3 Vi = 1.0520° 138.6 MW 45.2 Mvar Figure Q2 The magnitude of voltage at
Q2. i) The one-line diagram of simple three-bus power system with generation at bus 1 is shown in figure Q2. 0.02 + 30.04 2 256.6 MW 0.0125 + 30.025 +110.2 Mvar 0.01 + 30.03 Slack Bus 3 Vi = 1.0520° 138.6 MW 45.2 Mvar Figure Q2 The magnitude of voltage at bus 1 is adjusted to 1.05 per unit. The scheduled loads at buses 2 and 3 are as marked on the diagram. Line impedances are marked in per unit...
(POWER SYSTEM ANALYSIS) Load + Load Figure 1. One line diagram of a three bus power...
 (POWER SYSTEM ANALYSIS) Load + Load Figure 1. One line diagram of a three bus power transmission system. In Figure 1, the power flows in the transmission lines are to be found. In this system, 100 MVA and 154 kV are the base values. The generator bus, which is shown as Bus 1, is considered to be an infinite bus and the voltage magnitude and the angle are 1 and 0°, respectively. The voltages of Bus 2 and Bus 3...
Q2. (40) Eig. 1 shows the one-line diagram of a simple three-bus power system with generation at bus 1. The magnitude of voltage at bus 1 is adjusted to 1.05 pu. The scheduled loads at buses 2 and 3...
 Q2. (40) Eig. 1 shows the one-line diagram of a simple three-bus power system with generation at bus 1. The magnitude of voltage at bus 1 is adjusted to 1.05 pu. The scheduled loads at buses 2 and 3 are as marked on the diagram. Line imepdances are marked in pu on a 100 MVA base and the line charging susceptances are neglected a) (30) Using the GS (Gauss-Seidael) method, voltage phasors at the load buses 2 and 3 (P-Q...
The one-line diagram of a simple power system is shown in Figure 1. The neutral of...
 The one-line diagram of a simple power system is shown in Figure 1. The neutral of each generator is grounded through a current-limiting reactor of 0.25/3 per unit on a 100-MVA base. The system data expressed in per unit on a common 100-MVA base is tabulated below. The generators are running on no-load at their rated voltage and rated frequency with their emfs in phase. Determine the fault current for the following faults giving Zo = 0.35, Z = 0.22...
Determine the Capacitance in uF (micro-Farads) of the system below using the data, graph and tolerance...
 Determine the Capacitance in uF (micro-Farads) of the system
below using the data, graph and tolerance graph below.
R -ww G(s) 1/(RCs+1) ei R =1000 ohms 1 Slope T c(t) c() = 1 - e-(1/T B 0.632 Tolerance graph (Ts(2%) = 4*T): A A 4T 2T 3T 5T 63.2% 86.5% 95% 98.2% Of output 99.3% 0.75 0.5 Output curve: 0.25 0 0 0.025 0.05 0.075 0.1 0.125 Data: x(time) y(amplitude) 0.001 0.09516258196 0.002 0.1812692469 0.2591817793 0.003 0.329679954 0.004 0.3934693403 0.005...
Determine the Capacitance in uF (micro-Farads) of the system
below using the data, graph and tolerance graph below.
R -ww G(s) 1/(RCs+1) ei R =1000 ohms 1 Slope T c(t) c() = 1 - e-(1/T B 0.632 Tolerance graph (Ts(2%) = 4*T): A A 4T 2T 3T 5T 63.2% 86.5% 95% 98.2% Of output 99.3% 0.75 0.5 Output curve: 0.25 0 0 0.025 0.05 0.075 0.1 0.125 Data: x(time) y(amplitude) 0.001 0.09516258196 0.002 0.1812692469 0.2591817793 0.003 0.329679954 0.004 0.3934693403 0.005...
PLEASE ANSWER 1-4b. AND EXPLAIN ANSWERS. THIS IS SECOND TIME I ASKED QUESTION PLEASE ONLY ANSWER...
 PLEASE ANSWER 1-4b. AND EXPLAIN ANSWERS.
THIS IS SECOND TIME I ASKED QUESTION PLEASE ONLY ANSWER IF YOU ARE
SURE YOU ARE CORRECT.
EXHIBITS BELOW:
Casey Nelson is a divisional manager for Pigeon Company. His annual pay raises are largely determined by his division's return on investment (ROI), which has been above 22% each of the last three years. Casey is considering a capital budgeting project that would require a $3,800,000 investment in equipment with a useful life of five...
PLEASE ANSWER 1-4b. AND EXPLAIN ANSWERS.
THIS IS SECOND TIME I ASKED QUESTION PLEASE ONLY ANSWER IF YOU ARE
SURE YOU ARE CORRECT.
EXHIBITS BELOW:
Casey Nelson is a divisional manager for Pigeon Company. His annual pay raises are largely determined by his division's return on investment (ROI), which has been above 22% each of the last three years. Casey is considering a capital budgeting project that would require a $3,800,000 investment in equipment with a useful life of five...
 Figure 1 shows the one line diagram of a simple power system. Generators are connected at buses 1 and 3 while the loads are indicated at all five buses. Base values for transmission system are 100 MVA, 138 kV. The line data of Table 1 gives per unit series impedances and the charging MVar accounting for the distributed capacitance of the 5 lines. The bus data in Table 2 list values for P, Q and Vat each bus. The slack...
 Consider the single line diagram of a 3-bus power system shown in Figure 2. Slack bus 3 Figure 2. The data for this system are given in Tables 1 and 2. Bus Table 1 Generation Load Assumed PG QGPLQL bus voltage (MW) (MVar) (MW) (MVar) 1.05 +10.0 - - 1.0 + 0.0 50 30 305.6 140.2 1.0 +0.0 0.0 0.0 138.6 45.2 slack bus) Table 2 Bus-to-bus Impedance 0.2 + j0.04 .01 +0.03 2.3 0.0125 + j0.025 (0) Convert all...
 The six-bus system shown in Figure 1 will be simulated using MATLAB. Transmission line data and bus data are given in Tables 1 and 2 respectively. The transmission line data are calculated on 100 MVA base and 230 (line-to-line) kV base for generator. Tasks: 1. Determine the network admittance matrix Y 2. Find the load flow solution using Gauss-Seidel/Newton Raphson method until first iteration by manual calculation. Use Maltab software to solve power flow problem using Gauss-Seidel method. Find the...
 Figure 3, shows the one-line diagram of a simple three-bus power system with generation at buses 1 and 3 . The voltage at bus 1 is \(V_{1}=1.025 \angle 0^{\circ}\) per unit. Voltage magnitude at bus 3 is fixed at \(1.03\) pu with a real power generation of \(300 \mathrm{MW}\). A load consisting of \(400 \mathrm{MW}\) and \(200 \mathrm{Mvar}\) is taken from bus 2. Line impedances are marked in per unit on a 100-MVA base. For the purpose of hand calculations,...
 (POWER SYSTEM ANALYSIS) Load + Load Figure 1. One line diagram of a three bus power transmission system. In Figure 1, the power flows in the transmission lines are to be found. In this system, 100 MVA and 154 kV are the base values. The generator bus, which is shown as Bus 1, is considered to be an infinite bus and the voltage magnitude and the angle are 1 and 0°, respectively. The voltages of Bus 2 and Bus 3...
 Q2. (40) Eig. 1 shows the one-line diagram of a simple three-bus power system with generation at bus 1. The magnitude of voltage at bus 1 is adjusted to 1.05 pu. The scheduled loads at buses 2 and 3 are as marked on the diagram. Line imepdances are marked in pu on a 100 MVA base and the line charging susceptances are neglected a) (30) Using the GS (Gauss-Seidael) method, voltage phasors at the load buses 2 and 3 (P-Q...
 The one-line diagram of a simple power system is shown in Figure 1. The neutral of each generator is grounded through a current-limiting reactor of 0.25/3 per unit on a 100-MVA base. The system data expressed in per unit on a common 100-MVA base is tabulated below. The generators are running on no-load at their rated voltage and rated frequency with their emfs in phase. Determine the fault current for the following faults giving Zo = 0.35, Z = 0.22...
 Determine the Capacitance in uF (micro-Farads) of the system
below using the data, graph and tolerance graph below.
R -ww G(s) 1/(RCs+1) ei R =1000 ohms 1 Slope T c(t) c() = 1 - e-(1/T B 0.632 Tolerance graph (Ts(2%) = 4*T): A A 4T 2T 3T 5T 63.2% 86.5% 95% 98.2% Of output 99.3% 0.75 0.5 Output curve: 0.25 0 0 0.025 0.05 0.075 0.1 0.125 Data: x(time) y(amplitude) 0.001 0.09516258196 0.002 0.1812692469 0.2591817793 0.003 0.329679954 0.004 0.3934693403 0.005...
Determine the Capacitance in uF (micro-Farads) of the system
below using the data, graph and tolerance graph below.
R -ww G(s) 1/(RCs+1) ei R =1000 ohms 1 Slope T c(t) c() = 1 - e-(1/T B 0.632 Tolerance graph (Ts(2%) = 4*T): A A 4T 2T 3T 5T 63.2% 86.5% 95% 98.2% Of output 99.3% 0.75 0.5 Output curve: 0.25 0 0 0.025 0.05 0.075 0.1 0.125 Data: x(time) y(amplitude) 0.001 0.09516258196 0.002 0.1812692469 0.2591817793 0.003 0.329679954 0.004 0.3934693403 0.005...
 PLEASE ANSWER 1-4b. AND EXPLAIN ANSWERS.
THIS IS SECOND TIME I ASKED QUESTION PLEASE ONLY ANSWER IF YOU ARE
SURE YOU ARE CORRECT.
EXHIBITS BELOW:
Casey Nelson is a divisional manager for Pigeon Company. His annual pay raises are largely determined by his division's return on investment (ROI), which has been above 22% each of the last three years. Casey is considering a capital budgeting project that would require a $3,800,000 investment in equipment with a useful life of five...
PLEASE ANSWER 1-4b. AND EXPLAIN ANSWERS.
THIS IS SECOND TIME I ASKED QUESTION PLEASE ONLY ANSWER IF YOU ARE
SURE YOU ARE CORRECT.
EXHIBITS BELOW:
Casey Nelson is a divisional manager for Pigeon Company. His annual pay raises are largely determined by his division's return on investment (ROI), which has been above 22% each of the last three years. Casey is considering a capital budgeting project that would require a $3,800,000 investment in equipment with a useful life of five...
Most questions answered within 3 hours.
-
A
circular loop in the plane of a paper lies inca0.65 T magnetic
field pointing into...
asked 1 minute ago -
A business owner is trying to decide whether to buy, rent, or
lease office space and...
asked 1 minute ago -
Thermal Storage Solar heating of a house is much more efficient
if there is a way...
asked 18 minutes ago -
Considering the “fits” for group and job design dimensions,
suppose you had 12 employees with different...
asked 26 minutes ago -
Consider TCP connection management.
How many segments are typically involved in the TCP connection
establishment? What...
asked 36 minutes ago -
1. You placed a stop-loss order to sell 500 shares of AAPL with
a stop price...
asked 44 minutes ago -
Sylva Warehousing desired to locate a central warehouse to serve
five North Carolina markets. Placed on...
asked 46 minutes ago -
A regression was run to determine if there is a relationship
between hours of TV watched...
asked 53 minutes ago -
The theoretical yield of a reaction is the amount of product
obtained if the limiting reactant...
asked 1 hour ago -
You are an intern at a leading investment bank. Your manager
assigned you a project to...
asked 58 minutes ago -
Please explain how to determine polarity for me.
Rank the following covalent bonds by decreasing
polarity....
asked 1 hour ago -
1. Express the confidence interval 86.5%±4.6% in interval
form
2. Assume that a sample is used...
asked 1 hour ago