
Homework Answers
Please find the excel output for Regression:

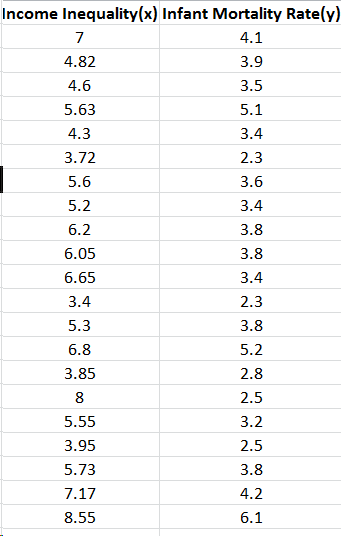
So Regression Equation is:
Infant Mortality Rate(y) = Income Inequality(x) * 0.4288 + 1.2413
Slope = 0.4288
Intercept = 1.2413
r = 0.6266
r2 = 0.3927
From above equation we can say that, if income inequality increases by 1 unit, there is an increase of 0.4288 units in infant mortality rate.
Also with an r2 value of 0.3927, we can say that 39.27% of variance in Infant mortality rate is explained by Income Inequality.
There exists a moderate correlation between Infant mortality rate and Income Inequality.
Add Answer to:
6. The table below contains data on income inequality and infant mortality for 21 OECD countries....
HI, I need help with this question. Please answer in details. The data set is found below for eac...
 HI, I need help with this question. Please answer in details.
The data set is found below for each countries sugar consumption.
Thanks!
Country,Sugar, GDP, Continent Albania,15.3,4556.144342, Europe Argentina, 38.1,13693.70379, South America Armenia, 33.2,3421.704509, Europe Australia, 34.1, 62080.98242, Europe Austria, 37.9,49485.48219, Europe Azerbaijan,13.9,7189.691229, Europe Belarus,31.8,6305.773662, Europe Belgium, 41.4,46463.60378, Europe Bosnia and Herzegovina,13.4,4754.197861, Europe Brazil, 36.5,12576.19559, South America Canada, 31.3,51790.56695, North America Chile, 41.7,14510.9661, South America China, 6.2,5447.309378,Asia Colombia,23.2, 7124.54892, South America Czech Republic, 30.6,20584.92655, Europe Denmark, 38,59911.90466,Europe Egypt, 26.4,2972.583516,Africa Estonia,31.4,16982.30031,...
HI, I need help with this question. Please answer in details.
The data set is found below for each countries sugar consumption.
Thanks!
Country,Sugar, GDP, Continent Albania,15.3,4556.144342, Europe Argentina, 38.1,13693.70379, South America Armenia, 33.2,3421.704509, Europe Australia, 34.1, 62080.98242, Europe Austria, 37.9,49485.48219, Europe Azerbaijan,13.9,7189.691229, Europe Belarus,31.8,6305.773662, Europe Belgium, 41.4,46463.60378, Europe Bosnia and Herzegovina,13.4,4754.197861, Europe Brazil, 36.5,12576.19559, South America Canada, 31.3,51790.56695, North America Chile, 41.7,14510.9661, South America China, 6.2,5447.309378,Asia Colombia,23.2, 7124.54892, South America Czech Republic, 30.6,20584.92655, Europe Denmark, 38,59911.90466,Europe Egypt, 26.4,2972.583516,Africa Estonia,31.4,16982.30031,...
Human Development Data Set: Questions are posted in next post. C1-T INTERNET GDP CO2 CELLULAR FERTILITY...
Human Development Data Set: Questions are posted in next post. C1-T INTERNET GDP CO2 CELLULAR FERTILITY LITERACY Algeria 0.65 6.09 3 0.3 2.8 58.3 Argentina 10.08 11.32 3.8 19.3 2.4 96.9 Australia 37.14 25.37 18.2 57.4 1.7 100 Austria 38.7 26.73 7.6 81.7 1.3 100 Belgium 31.04 25.52 10.2 74.7 1.7 100 Brazil 4.66 7.36 1.8 16.7 2.2 87.2 Canada 46.66 27.13 14.4 36.2 1.5 100 Chile 20.14 9.19 4.2 34.2 2.4 95.7 China 2.57 4.02 2.3 11 1.8 78.7...
11.38 Building a multiple linear regression model. Let’s now build a model to predict the life-satisfaction...
11.38 Building a multiple linear regression model. Let’s now build a model to predict the life-satisfaction score, LSI. (a) Consider a simple linear regression using GINI as the explanatory variable. Run the regression and summarize the results. Be sure to check assumptions. (b) Now consider a model using GINI and LIFE. Run the multiple regression and summarize the results. Again be sure to check assumptions. (c) Now consider a model using GINI, LIFE, and DEMOCRACY. Run the multiple regression and...
Sangria Topochico - The Capital Budgeting Decision In December 2012, María Guadalupe, the owner of Sidral...
 Sangria Topochico - The Capital Budgeting Decision In December 2012, María Guadalupe, the owner of Sidral Mundet Sol, had just finished reading a report done by his general manager, Francisco Javier, about the possible investment in a new product line, Sangria Topochico. The idea of Sangria Topochico came about three months earlier when María attended a seminar on youth obesity organized by a local high school that his two children attended. Even though he had often heard of the rising...
 HI, I need help with this question. Please answer in details.
The data set is found below for each countries sugar consumption.
Thanks!
Country,Sugar, GDP, Continent Albania,15.3,4556.144342, Europe Argentina, 38.1,13693.70379, South America Armenia, 33.2,3421.704509, Europe Australia, 34.1, 62080.98242, Europe Austria, 37.9,49485.48219, Europe Azerbaijan,13.9,7189.691229, Europe Belarus,31.8,6305.773662, Europe Belgium, 41.4,46463.60378, Europe Bosnia and Herzegovina,13.4,4754.197861, Europe Brazil, 36.5,12576.19559, South America Canada, 31.3,51790.56695, North America Chile, 41.7,14510.9661, South America China, 6.2,5447.309378,Asia Colombia,23.2, 7124.54892, South America Czech Republic, 30.6,20584.92655, Europe Denmark, 38,59911.90466,Europe Egypt, 26.4,2972.583516,Africa Estonia,31.4,16982.30031,...
HI, I need help with this question. Please answer in details.
The data set is found below for each countries sugar consumption.
Thanks!
Country,Sugar, GDP, Continent Albania,15.3,4556.144342, Europe Argentina, 38.1,13693.70379, South America Armenia, 33.2,3421.704509, Europe Australia, 34.1, 62080.98242, Europe Austria, 37.9,49485.48219, Europe Azerbaijan,13.9,7189.691229, Europe Belarus,31.8,6305.773662, Europe Belgium, 41.4,46463.60378, Europe Bosnia and Herzegovina,13.4,4754.197861, Europe Brazil, 36.5,12576.19559, South America Canada, 31.3,51790.56695, North America Chile, 41.7,14510.9661, South America China, 6.2,5447.309378,Asia Colombia,23.2, 7124.54892, South America Czech Republic, 30.6,20584.92655, Europe Denmark, 38,59911.90466,Europe Egypt, 26.4,2972.583516,Africa Estonia,31.4,16982.30031,...
 Sangria Topochico - The Capital Budgeting Decision In December 2012, María Guadalupe, the owner of Sidral Mundet Sol, had just finished reading a report done by his general manager, Francisco Javier, about the possible investment in a new product line, Sangria Topochico. The idea of Sangria Topochico came about three months earlier when María attended a seminar on youth obesity organized by a local high school that his two children attended. Even though he had often heard of the rising...
Most questions answered within 3 hours.
-
Asked if he has any regrets about the way he's handled the
coronavirus crisis so far,...
asked 1 minute from now -
True or False?
Considering a door as a rigid body. Its angular motion happens
in a...
asked 1 minute ago -
In
IUPAC naming, do we concider the prefix in alphabatizing?
In other words do we look...
asked 6 minutes ago -
If a trust has income required to be distributed of $11,500,
other amounts paid or required...
asked 23 minutes ago -
The degree of ionization of a weak acid
____________________.
Select all that are True.
a) varies...
asked 23 minutes ago -
Cereal for Breakfast. A cereal company claims
70% of Americans start the day with cereal for...
asked 23 minutes ago -
An elevator has a placard stating that the maximum capacity is
2400 lblong dash15 passengers. So,...
asked 26 minutes ago -
two charged proteins P1 and P2 are located at the positions
(1m,1m) and (-1m,1m) respectively on...
asked 37 minutes ago -
eBook
Calculator
Job Order Cost Sheet
Remnant Carpet Company sells and installs commercial carpeting
for office...
asked 42 minutes ago -
Using Kapustinskii equation, determine the lattice energy of a
hypothetical compound NaCl2 . Assume the sum...
asked 44 minutes ago -
Most schools and
businesses require some standard style of documentation for written
reports. Discuss why might...
asked 41 minutes ago -
cookbooks are going metric. in such books 1 cup is equal to 240
ml. Express 1...
asked 44 minutes ago