Knapsack problem. From the following list of potential projects, use Excel solver to find the opt...
Knapsack problem.
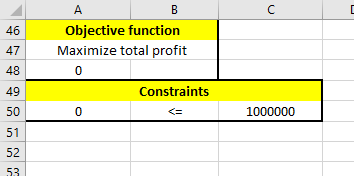
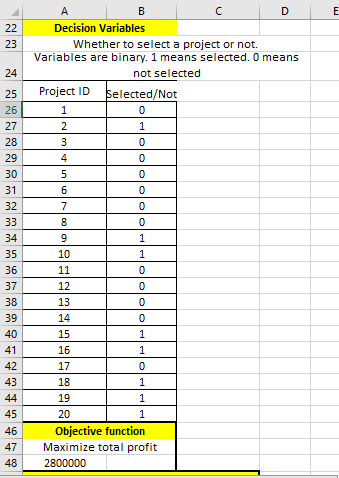
From the following list of potential projects, use Excel solver to find the optimal allocation of your budget of $1,000,000 to maximize profit. Select the projects that you will select and attach your answer report.
|
Project ID |
Cost |
Expected profit |
Check selected |
|
1 |
$400,000 |
$1,000,000 |
|
|
2 |
$50,000 |
$400,000 |
|
|
3 |
$300,000 |
$800,000 |
|
|
4 |
$150,000 |
$300,000 |
|
|
5 |
$400,000 |
$600,000 |
|
|
6 |
$600,000 |
$2,000,000 |
|
|
7 |
$200,000 |
$300,000 |
|
|
8 |
$250,000 |
$700,000 |
|
|
9 |
$100,000 |
$300,000 |
|
|
10 |
$100,000 |
$300,000 |
|
|
11 |
$250,000 |
$100,000 |
|
|
12 |
$350,000 |
$700,000 |
|
|
13 |
$400,000 |
$600,000 |
|
|
14 |
$500,000 |
$1,000,000 |
|
|
15 |
$50,000 |
$200,000 |
|
|
16 |
$200,000 |
$400,000 |
|
|
17 |
$350,000 |
$800,000 |
|
|
18 |
$50,000 |
$100,000 |
|
|
19 |
$150,000 |
$400,000 |
|
|
20 |
$300,000 |
$700,000 |
Homework Answers


Add Answer to:
Knapsack problem. From the following list of potential projects, use Excel solver to find the opt...
Balance Sheets Liabilities R.A Ltd. A.R Ltd. Assets R.A Ltd. A.R Ltd. Share Capital £ 600,000...
Balance Sheets Liabilities R.A Ltd. A.R Ltd. Assets R.A Ltd. A.R Ltd. Share Capital £ 600,000 £ 800,000 Land and Building £ 500,000 £ 800,000 Reseve and Surplus £ 150,000 £ 350,000 Plant and Machinery £ 300,000 £ 700,000 14% Debentures £ 400,000 £ 1,000,000 Furniture £ 200,000 £ 400,000 Mortgaged Loan £ 100,000 £ 500,000 Office Equipments £ 110,000 £ 230,000 Sundry Creditors £ 200,000 £ 300,000 Stock £ 300,000 £ 500,000 Bills Payable £ 100,000 £ 250,000 Sundry...
5. Quark Industries has four potential projects, all with an initial cost of $2,000,000. The capital budget for the...
 5. Quark Industries has four potential projects, all with an initial cost of $2,000,000. The capital budget for the year will allow Quark Industries to accept only one of the four projects. Given the discount rates and the future cash flows of each project, determine which project Quark should accept Cash Flow Year 1 Year 2 Year 3 Project M $500,000 $500,000 $500,000 $500,000 $500,000 6% Project N $600,000 $600,000 $600,000 $600,000 $600,000 9% Project $1,000,000 $ 800,000 $ 600,000...
(a) Calculate the IRR, NPV, Annual Percentage Rate and Payback Period for the following projects: PROJECT...
(a) Calculate the IRR, NPV, Annual Percentage Rate and Payback Period for the following projects: PROJECT A B C D Inicial Investment 1,000,000 2,000,000 2,000,000 1,000,000 (b) Consider the cash flow projection for the next four years. Compare the projects and determine what is the best option for an investor that wants a 10% minimum aceptable rate of return. Years Project A Project B Project C Project D 1 300,000 400,000 400,000 1,000,000 2 400,000 200,000 200,000 1,000,000 3 500,000...
Find the profit margin, ROA, and ROE for each period. X2 X3 X4 $2,500,000 3.200,000 3,500,000...
 Find the profit margin, ROA, and ROE for each period.
X2 X3 X4 $2,500,000 3.200,000 3,500,000 4,000,000 1.900.000 2400.0002.700.000 3200.000 800,000 400,00D 25,000 200,000 10.000 20.000 30.000 60.000 15,000 107,500 COST OF GOODS SOLD GROSS PROFIT SELLING & ADMINISTRATIVE EXPENSE DEPRECIATION LEASES MISCELLANEOUS EXPENSE 600,000 400,000 800,000 800,000 400,000 160,000 190,000 138,700 25,000 175,000 170,000 89,000 EARNINGS BEFORE INTEREST & TAXES INTEREST EARNINGS BEFORE TAXES TAXES (35%) NET INCOME DIVIDENDS RETAINED EARNINGS 125,000 87,000 56,550 7,850 50,000 40,000 CASH ACCOUNTS...
Find the profit margin, ROA, and ROE for each period.
X2 X3 X4 $2,500,000 3.200,000 3,500,000 4,000,000 1.900.000 2400.0002.700.000 3200.000 800,000 400,00D 25,000 200,000 10.000 20.000 30.000 60.000 15,000 107,500 COST OF GOODS SOLD GROSS PROFIT SELLING & ADMINISTRATIVE EXPENSE DEPRECIATION LEASES MISCELLANEOUS EXPENSE 600,000 400,000 800,000 800,000 400,000 160,000 190,000 138,700 25,000 175,000 170,000 89,000 EARNINGS BEFORE INTEREST & TAXES INTEREST EARNINGS BEFORE TAXES TAXES (35%) NET INCOME DIVIDENDS RETAINED EARNINGS 125,000 87,000 56,550 7,850 50,000 40,000 CASH ACCOUNTS...
Calculate the accounts receivable turnover, average collection period (days), inventory turnover, fixed asset turnover, and total...
 Calculate the accounts receivable turnover, average collection
period (days), inventory turnover, fixed asset turnover, and total
asset turnover for each period.
X2 X3 X4 $2,500,000 3.200,000 3,500,000 4,000,000 1.900.000 2400.0002.700.000 3200.000 800,000 400,00D 25,000 200,000 10.000 20.000 30.000 60.000 15,000 107,500 COST OF GOODS SOLD GROSS PROFIT SELLING & ADMINISTRATIVE EXPENSE DEPRECIATION LEASES MISCELLANEOUS EXPENSE 600,000 400,000 800,000 800,000 400,000 160,000 190,000 138,700 25,000 175,000 170,000 89,000 EARNINGS BEFORE INTEREST & TAXES INTEREST EARNINGS BEFORE TAXES TAXES (35%) NET INCOME...
Calculate the accounts receivable turnover, average collection
period (days), inventory turnover, fixed asset turnover, and total
asset turnover for each period.
X2 X3 X4 $2,500,000 3.200,000 3,500,000 4,000,000 1.900.000 2400.0002.700.000 3200.000 800,000 400,00D 25,000 200,000 10.000 20.000 30.000 60.000 15,000 107,500 COST OF GOODS SOLD GROSS PROFIT SELLING & ADMINISTRATIVE EXPENSE DEPRECIATION LEASES MISCELLANEOUS EXPENSE 600,000 400,000 800,000 800,000 400,000 160,000 190,000 138,700 25,000 175,000 170,000 89,000 EARNINGS BEFORE INTEREST & TAXES INTEREST EARNINGS BEFORE TAXES TAXES (35%) NET INCOME...
Calculate the current ratio, quick ratio, long-term debt/total assets, times interest earned, and fixed cost coverage...
 Calculate the current ratio, quick ratio, long-term debt/total
assets, times interest earned, and fixed cost coverage using the
picture below.
X2 X3 X4 $2,500,000 3.200,000 3,500,000 4,000,000 1.900.000 2400.0002.700.000 3200.000 800,000 400,00D 25,000 200,000 10.000 20.000 30.000 60.000 15,000 107,500 COST OF GOODS SOLD GROSS PROFIT SELLING & ADMINISTRATIVE EXPENSE DEPRECIATION LEASES MISCELLANEOUS EXPENSE 600,000 400,000 800,000 800,000 400,000 160,000 190,000 138,700 25,000 175,000 170,000 89,000 EARNINGS BEFORE INTEREST & TAXES INTEREST EARNINGS BEFORE TAXES TAXES (35%) NET INCOME DIVIDENDS...
Calculate the current ratio, quick ratio, long-term debt/total
assets, times interest earned, and fixed cost coverage using the
picture below.
X2 X3 X4 $2,500,000 3.200,000 3,500,000 4,000,000 1.900.000 2400.0002.700.000 3200.000 800,000 400,00D 25,000 200,000 10.000 20.000 30.000 60.000 15,000 107,500 COST OF GOODS SOLD GROSS PROFIT SELLING & ADMINISTRATIVE EXPENSE DEPRECIATION LEASES MISCELLANEOUS EXPENSE 600,000 400,000 800,000 800,000 400,000 160,000 190,000 138,700 25,000 175,000 170,000 89,000 EARNINGS BEFORE INTEREST & TAXES INTEREST EARNINGS BEFORE TAXES TAXES (35%) NET INCOME DIVIDENDS...
Calculate the following for each of the years listed A. Debt/ Equity ratio B. Debt/asset ratio...
Calculate the following for each of the years listed A. Debt/ Equity ratio B. Debt/asset ratio C.Profit Margin (as a %) D. Gross Margin (as a %) E. Calculate the change in profit margin over each year Exhibit 1: Iggy’s Financial Statements, 1994-1999 1994 1995 1996 1997 1998 1999 Income Statement Data Net revenue 1,000,000 2,500,000 3,000,000 4,000,000 4,500,000 6,000,000 Cost of goods sold Labor Other 570,000 220,000 350,000 1,700,000 900,000 800,000 1,920,000 1,080,000 840,000 2,520,000 1,480,000 1,040,000 3,195,000 1,890,000...
From the following information, prepare a worksheet to prepare consolidated balance sheet for parents and its...
From the following information, prepare a worksheet to prepare consolidated balance sheet for parents and its subs using cost method. Parent Investment in Sub1 $20,000 Investment in sub2 $400,000 Investment in Sub 3 $1,000,000 Investment in sub 4 $2,000,000 Investment in Sub 5 $5,000,000 Parent’s other assets $30,000,000 Parent’s Liabilities $1,000,000 Common Stock Parent $20,000,000 Parent’s Ret Earnings $17,600,000 Common Stock Sub 1 $100,000 Retained earnings of Sub 1 $100,000 Common Stock sub 2 $50,000 Retained earnings sub 2 $550,000...
Discontinue a Segment Esther Corporation has the following three divisions, Alpha, Bravo and Charlie. Determine whether...
Discontinue a Segment Esther Corporation has the following three divisions, Alpha, Bravo and Charlie. Determine whether or not Charlie Division should be discontinued. All fixed costs are unavoidable. Alpha Bravo Charlie Total Sales 500,000 450,000 600,000 1,550,000 Cost of Goods Sold Variable 200,000 150,000 300,000 650,000 Fixed 50,000 50,000 100,000 200,000 Total CGS 250,000 200,000 400,000 850,000 Gross Margin 250,000 250,000 200,000 700,000 Operating Expenses Variable 175,000 200,000 200,000 575,000 Fixed 25,000 25,000 25,000 75,000 Total Operating Expenses 200,000 225,000 225,000...
1. On 12/31, Choco acquired all assets and liabilities of Cake by issuing 40,000 shares of...
1. On 12/31, Choco acquired all assets and liabilities of Cake by issuing 40,000 shares of its common stock when the market value (=fair value) is $32/share and this combination is a statutory merger (Cake was dissolved). Choco has common stock with $15 par, 50,000 shares outstanding and Cake has $5 par, 60,000 shares outstanding Choco Book Values Cake Book Values Cake Fair Values Cash and Receivable 350,000 180,000 170,000 Inventories 250,000 100,000 150,000 Land 700,000 120,000 240,000 Building and...
 5. Quark Industries has four potential projects, all with an initial cost of $2,000,000. The capital budget for the year will allow Quark Industries to accept only one of the four projects. Given the discount rates and the future cash flows of each project, determine which project Quark should accept Cash Flow Year 1 Year 2 Year 3 Project M $500,000 $500,000 $500,000 $500,000 $500,000 6% Project N $600,000 $600,000 $600,000 $600,000 $600,000 9% Project $1,000,000 $ 800,000 $ 600,000...
 Find the profit margin, ROA, and ROE for each period.
X2 X3 X4 $2,500,000 3.200,000 3,500,000 4,000,000 1.900.000 2400.0002.700.000 3200.000 800,000 400,00D 25,000 200,000 10.000 20.000 30.000 60.000 15,000 107,500 COST OF GOODS SOLD GROSS PROFIT SELLING & ADMINISTRATIVE EXPENSE DEPRECIATION LEASES MISCELLANEOUS EXPENSE 600,000 400,000 800,000 800,000 400,000 160,000 190,000 138,700 25,000 175,000 170,000 89,000 EARNINGS BEFORE INTEREST & TAXES INTEREST EARNINGS BEFORE TAXES TAXES (35%) NET INCOME DIVIDENDS RETAINED EARNINGS 125,000 87,000 56,550 7,850 50,000 40,000 CASH ACCOUNTS...
Find the profit margin, ROA, and ROE for each period.
X2 X3 X4 $2,500,000 3.200,000 3,500,000 4,000,000 1.900.000 2400.0002.700.000 3200.000 800,000 400,00D 25,000 200,000 10.000 20.000 30.000 60.000 15,000 107,500 COST OF GOODS SOLD GROSS PROFIT SELLING & ADMINISTRATIVE EXPENSE DEPRECIATION LEASES MISCELLANEOUS EXPENSE 600,000 400,000 800,000 800,000 400,000 160,000 190,000 138,700 25,000 175,000 170,000 89,000 EARNINGS BEFORE INTEREST & TAXES INTEREST EARNINGS BEFORE TAXES TAXES (35%) NET INCOME DIVIDENDS RETAINED EARNINGS 125,000 87,000 56,550 7,850 50,000 40,000 CASH ACCOUNTS...
 Calculate the accounts receivable turnover, average collection
period (days), inventory turnover, fixed asset turnover, and total
asset turnover for each period.
X2 X3 X4 $2,500,000 3.200,000 3,500,000 4,000,000 1.900.000 2400.0002.700.000 3200.000 800,000 400,00D 25,000 200,000 10.000 20.000 30.000 60.000 15,000 107,500 COST OF GOODS SOLD GROSS PROFIT SELLING & ADMINISTRATIVE EXPENSE DEPRECIATION LEASES MISCELLANEOUS EXPENSE 600,000 400,000 800,000 800,000 400,000 160,000 190,000 138,700 25,000 175,000 170,000 89,000 EARNINGS BEFORE INTEREST & TAXES INTEREST EARNINGS BEFORE TAXES TAXES (35%) NET INCOME...
Calculate the accounts receivable turnover, average collection
period (days), inventory turnover, fixed asset turnover, and total
asset turnover for each period.
X2 X3 X4 $2,500,000 3.200,000 3,500,000 4,000,000 1.900.000 2400.0002.700.000 3200.000 800,000 400,00D 25,000 200,000 10.000 20.000 30.000 60.000 15,000 107,500 COST OF GOODS SOLD GROSS PROFIT SELLING & ADMINISTRATIVE EXPENSE DEPRECIATION LEASES MISCELLANEOUS EXPENSE 600,000 400,000 800,000 800,000 400,000 160,000 190,000 138,700 25,000 175,000 170,000 89,000 EARNINGS BEFORE INTEREST & TAXES INTEREST EARNINGS BEFORE TAXES TAXES (35%) NET INCOME...
 Calculate the current ratio, quick ratio, long-term debt/total
assets, times interest earned, and fixed cost coverage using the
picture below.
X2 X3 X4 $2,500,000 3.200,000 3,500,000 4,000,000 1.900.000 2400.0002.700.000 3200.000 800,000 400,00D 25,000 200,000 10.000 20.000 30.000 60.000 15,000 107,500 COST OF GOODS SOLD GROSS PROFIT SELLING & ADMINISTRATIVE EXPENSE DEPRECIATION LEASES MISCELLANEOUS EXPENSE 600,000 400,000 800,000 800,000 400,000 160,000 190,000 138,700 25,000 175,000 170,000 89,000 EARNINGS BEFORE INTEREST & TAXES INTEREST EARNINGS BEFORE TAXES TAXES (35%) NET INCOME DIVIDENDS...
Calculate the current ratio, quick ratio, long-term debt/total
assets, times interest earned, and fixed cost coverage using the
picture below.
X2 X3 X4 $2,500,000 3.200,000 3,500,000 4,000,000 1.900.000 2400.0002.700.000 3200.000 800,000 400,00D 25,000 200,000 10.000 20.000 30.000 60.000 15,000 107,500 COST OF GOODS SOLD GROSS PROFIT SELLING & ADMINISTRATIVE EXPENSE DEPRECIATION LEASES MISCELLANEOUS EXPENSE 600,000 400,000 800,000 800,000 400,000 160,000 190,000 138,700 25,000 175,000 170,000 89,000 EARNINGS BEFORE INTEREST & TAXES INTEREST EARNINGS BEFORE TAXES TAXES (35%) NET INCOME DIVIDENDS...
Most questions answered within 3 hours.
-
The free energy change for the following reaction at 25 °C, when
[Sn2+] = 1.17 M...
asked 56 minutes ago -
An MNE is this kind of industry when competition in one country
is essentially independent of...
asked 2 hours ago -
. For this set of questions, determine what
proportion of a normal distribution is located betweeneach...
asked 3 hours ago -
A college student is employed as a door-to-door newspaper
salesman. Historical data suggests that the student...
asked 3 hours ago -
MATLAB HW 11 problem using Switch Case and Input commands
Write a script file that calculates...
asked 3 hours ago -
Considering gravitational time dilation, calculate the time that
passes in Earth’s surface while 1 hour passes...
asked 4 hours ago -
Minitab Problem: Take the Lake Hume June rainfall data and find
use the processes outlined in...
asked 5 hours ago -
X Company is trying to decide whether to continue using old
equipment to make Product A...
asked 5 hours ago -
IN PYTHON ONLY !! Program 2: Re-work
program #5 (WeeklyHours) from the previous assignment such that...
asked 5 hours ago -
The average length of time between arrivals at a turnpike
toll-booth is 26 seconds. What is...
asked 7 hours ago -
(a) A piston at 6.1 atm contains a gas that occupies a volume of
3.5 L....
asked 8 hours ago -
Please answer true or false. Words
cannot be changed or added in to make it true...
asked 8 hours ago