ONLY DO NUMBER 3 For this project you will test claims and conjectures using hypothesis testing. ...
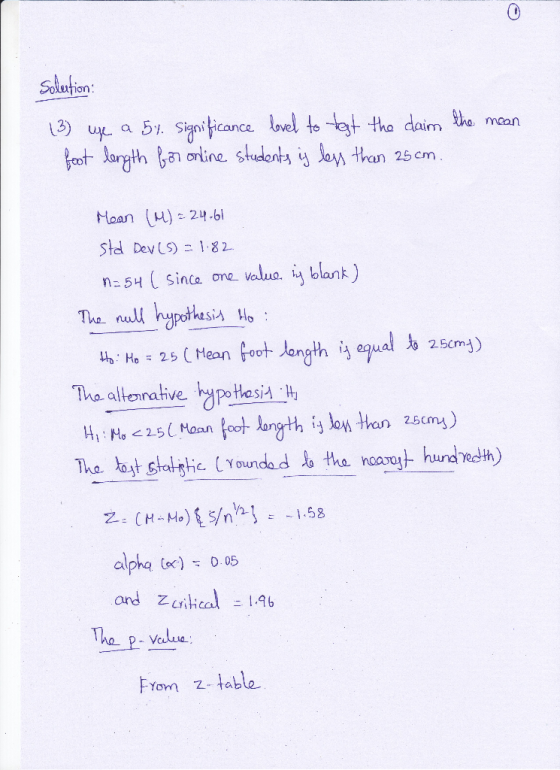
ONLY DO NUMBER 3 For this project you will test claims and conjectures using hypothesis testing. For each hypothesis test, report the following: The null hypothesis, H0 The alternative hypothesis, H1 The test statistic rounded to the nearest hundredth (use T Stats or Proportion Stats in StatCrunch to find test statistics) The P-value for the test (use T Stats or Proportion Stats in StatCrunch to find P-values) The formal decision (Reject H0 or Fail to reject H0, remember that reject H0 means there is enough evidence to support H1 and fail to reject H0 means there is not enough evidence to support H1. If there is not enough evidence to support H1 then the null hypothesis is not necessarily the truth. It is just one plausible explanation for what we see in the sample.) The conclusion of the test in non-technical terms (in terms of the problem at hand) Remember that each of these test is either a test for the population proportion, p, or a test for the population mean, LaTeX: \mu μ . You have to decide which is which and set up the hypotheses accordingly. Once you know what parameter you are testing (p or LaTeX: \mu μ ), then that determines which function you should use in StatCrunch to find the test statistic (either a z or a t value) and the P-value for the test. Make sure you use StatCrunch to find test statistics and P-values for these tests! Once you have the P-value for the test, you can compare the P-value to the significance level for the test and make your formal decision. Once you have your formal decision, then state what the conclusion of the test is in more non-technical terms. Note, you DO NOT have to report critical values for these tests; you can make the decision for the test using the P-value. Refer to the resources on the course home page for more information about hypothesis testing and how to use StatCrunch to find test statistics and P-values. Here is a template for reporting the answer for a sample problem. Sample problem: Use a 1% significance level to test the claim the proportion of all people who use their smart phones to watch movies is 40%. Null hypothesis: H0: p = 0.4 Alternative Hypothesis: H1: p LaTeX: \ne ≠ 0.4 Test Statistic: z = 1.67 P-value: 0.0475 Decision: Fail to reject the null hypothesis Conclusion: There is not enough evidence to conclude the proportion of all people who use their smart phones to watch movies is different from 40%. It is plausible 40% of smart phone users watch movies on their smart phones. ************************************************************************* To complete this project, use the class data and hypothesis tests to tests the claims stated below. Type your answers in a Microsoft Word or rich text file document making sure to clearly show your answers to each problem and upload your document to submit your work. Use the Grapevine Online Statistics Data File in StatCrunch shared by user sgrapevine. Assume this data is representative of all online students. Each problem is worth a total of 6 points (1 point for each correct test component). You can also earn one point for rounding as directed for a total of 43 points. Note, this is not a team project. You must submit your own original work! ONLY DO NUMBER 3 1) Use a 5% significance level to test the claim the average online student gets less than 8 hours of sleep on week nights (not on weekends). 2) Use a 1% significance level to test the claim a majority (over 50%) of online students will call "heads" will given the option to call a coin toss. 3) Use a 5% significance level to test the claim the mean foot length for online students is less than 25 cm. 4) Use a 5% significance level to test the claim the mean number of letters in the last names of online students is different from 6 letters (the most common last name size according to https://www.quora.com/What-is-the-average-length-of-last-names-in-the-United-States (Links to an external site.)Links to an external site.). 5) Use a 5% significance level to test the claim that less than 20% of online students think cats make the best pet. 6) Use a 1% significance level to test the claim the proportion of online students that pick the number 5 when asked to pick a number between 1 and 5 is different from 20%. 7) Use a 5% significance level to test the claim the proportion of online students with blue eyes is 8%. Note, the website www.aclens.com (Links to an external site.)Links to an external site.reports about 8% of the world's population has blue eyes. ONLY DO NUMBER 3
Homework Answers

Add Answer to:
ONLY DO NUMBER 3 For this project you will test claims and conjectures using hypothesis testing. ...
ONLY DO NUMBER 7 For this project you will test claims and conjectures using hypothesis testing. ...
ONLY DO NUMBER 7 For this project you will test claims and conjectures using hypothesis testing. For each hypothesis test, report the following: The null hypothesis, H0 The alternative hypothesis, H1 The test statistic rounded to the nearest hundredth (use T Stats or Proportion Stats in StatCrunch to find test statistics) The P-value for the test (use T Stats or Proportion Stats in StatCrunch to find P-values) The formal decision (Reject H0 or Fail to reject H0, remember that reject...
State your decision to the significance test in terms of the null hypothesis. According to a...
State your decision to the significance test in terms of the null hypothesis. According to a recent poll, the percentage of Americans who would vote for the incumbent president is 53%. If a random sample of 100 people in New York results in 45% who would vote for the incumbent, test the claim that the percentage of people in New York who would vote for the incumbent president is different from 53%. Use the following results and a 0.10 significance...
1. What are null hypothesis and alternative hypothesis? 2. Inastatisticaltest,wehavethechoiceofatwo-tailedtest,aleft- tailed test, or a right-tailed test. Which hypothesis is the determining factor fo...
1. What are null hypothesis and alternative hypothesis? 2. Inastatisticaltest,wehavethechoiceofatwo-tailedtest,aleft- tailed test, or a right-tailed test. Which hypothesis is the determining factor for choosing the direction of the test? (In other words, how would you decide it) 3. Forthesamesampledataandnullhypothesis,howdoesthe P-value for a two-tailed test compare to that for a one-tailed test? 4. Using P-value method, how would you reject or fail to reject the null hypothesis? (what is the decision criteria?) How does level of significance matter to the hypothesis...
1. Hypothesis Testing - Setup: Suppose you want to test the claim that the mean volume...
1. Hypothesis Testing - Setup: Suppose you want to test the claim that the mean volume in all 12-ounce cans of Fizzy Pop soda is equal to 12 ounces. In a sample of 120 cans, you find the sample mean is 12.2 ounces. (a) What is the claim? μ < 12 μ > 12 μ = 12 μ = 12.2 (b) What does μ represent? the proportion of all cans with a volume = 12 ounces the mean volume of...
A researcher claims that the proportion of college students who plan to participate in community service...
A researcher claims that the proportion of college students who plan to participate in community service after graduation is greater than 35%. To test this claim, a survey asked 500 randomly selected college students if they planned to perform community service after graduation. Of those students, 195 indicated they planned to perform community service. The following is the setup m the following hypothesis test: H0:p=0.35 Ha:p>0.35 In this example, the p-value was determined to be 0.030. Come to a conclusion...
(a) Suppose the null and alternative hypothesis of a test are: H0: μ= 9.7 H1: μ...
(a) Suppose the null and alternative hypothesis of a test are: H0: μ= 9.7 H1: μ >9.7 Then the test is: left-tailed two-tailed right-tailed (b) If you conduct a hypothesis test at the 0.02 significance level and calculate a P-value of 0.07, then what should your decision be? Fail to reject H0 Reject H0 Not enough information is given to make a decision
1. Conduct a test of the null hypothesis that the mean height for all students in...
1. Conduct a test of the null hypothesis that the mean height for all students in the Census at School database is equal to 155 cm vs the alternative that the mean Height is greater than 155 cm. Use a significance level of 0.05. a. State the null and alternative hypotheses. Ho: m = 155 Ha: m > 155 b. Provide the Statcrunch output table. Hypothesis test results: Variable Sample Mean Std. Err. DF T-Stat P-value Height 159.86 1.7311103 49...
Provide an appropriate response. The P- value for a hypothesis test is P= 0.034. Do you...
 Provide an appropriate response. The P- value for a hypothesis test is P= 0.034. Do you reject or fail to reject H0 when the level of significance is a 0.01? reject Ho fail to reject Ho not sufficient information to decide QUESTIO 8 points Save Answer Provide an appropriate response. You wish to test the claim that u s 24 at a level of significance of a 0.01 and are given sample statistics n 40 x-25.8 Assume the population standard...
Suppose you want to test the following hypotheses: H0: p ≥ 0.4 vs. H1: p <...
Suppose you want to test the following hypotheses: H0: p ≥ 0.4 vs. H1: p < 0.4. A random sample of 1000 observations was taken from the population. Answer the following questions and show your Excel calculation for each question clearly: (a) Let p ̂ be the sample proportion. What is the standard error of sample proportion (i.e., σ_p ̂ ) if H0 is true? (b) If the sample proportion obtained were 0.38 (i.e., p ̂=0.38), what is its p-value?...
A recent national survey found that high school students watched an average (mean) of 7.6 movies...
A recent national survey found that high school students watched an average (mean) of 7.6 movies per month with a population standard deviation of 0.5. The distribution of number of movies watched per month follows the normal distribution. A random sample of 41 college students revealed that the mean number of movies watched last month was 7.0. At the 0.05 significance level, can we conclude that college students watch fewer movies a month than high school students? State the null...
 Provide an appropriate response. The P- value for a hypothesis test is P= 0.034. Do you reject or fail to reject H0 when the level of significance is a 0.01? reject Ho fail to reject Ho not sufficient information to decide QUESTIO 8 points Save Answer Provide an appropriate response. You wish to test the claim that u s 24 at a level of significance of a 0.01 and are given sample statistics n 40 x-25.8 Assume the population standard...
Most questions answered within 3 hours.
-
Q1b. Provide an example of how pricing should interact
with the services offered by the retailer.
asked 5 minutes ago -
a mass weighing 8 pounds when attached to a spring, stretches
it 6 inches.the object is...
asked 12 minutes ago -
The following is part of the computer output from a regression
of monthly returns on Waterworks...
asked 17 minutes ago -
Bob Katz is purchasing a new Honda Pilot for $35,000. He is
financing $30,000 with a...
asked 20 minutes ago -
The equity holders of Super Nova, Inc. have 100 million of
equity in the firm. Because...
asked 19 minutes ago -
A sample of 240 observations is selected from a normal
population with a population standard deviation...
asked 36 minutes ago -
Write an (efficient) pseudocode for the implementation of each
of the following function prototypes (proper C...
asked 35 minutes ago -
Klingon Widgets, Inc., purchased new cloaking machinery three
years ago for $5.6 million. The machinery can...
asked 39 minutes ago -
Social work's goal of social betterment implies
A. That social workers should be models of good...
asked 36 minutes ago -
a
12 kg box sits on a horizontal table. a string with tension 30.4 N
pulls...
asked 37 minutes ago -
A circular coil of radius 0.120 m contains a single turn and is
located in a...
asked 49 minutes ago -
help me out
Velocity v = גf, wavelength ג = v/f and
Relative frequency = frequency...
asked 57 minutes ago