Toxic shock syndrome (TSS) is a severe illness associated with infections. While anyone can develop TSS, one of the primary risk factors is tampon usage. Given this widely known risk factor for TSS, there might be evidence to suggest that physicians are prone to diagnostic bias when diagnosing patients with TSS.
Refer to the table below, which relates to patient sex (Female vs. Male) to physician diagnosis for the patient (TSS Diagnosed vs. TSS Not Diagnosed). Note that all patients summarized in the table below did actually have TSS.

a. What is the odds ratio (OR) of a physician diagnosing TSS (‘TSS Diagnosed’) among those TSS patients that were female as compared to those TSS patients that were male? Provide the value of the OR and interpret the OR result in one to two complete sentences.
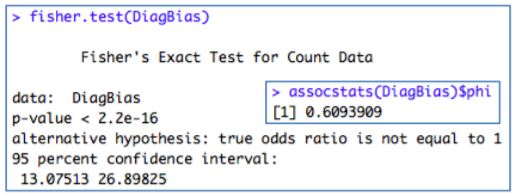
Fisher’s test was performed using the contingency table provided. The phi correlation coefficient was also calculated. Using the R output provided below, answer the following questions.
b. What is the probability that the CI estimate truly contains the population parameter? Note: If there is more than one possible answer, list all of the answers.
c. Interpret the meaning of the provided confidence interval in one to two sentences.
d. Based on the provided confidence interval, does there appear to be a significant difference in the odds of a physician diagnosing TSS between female patients and male patients? Is there a significant diagnostic bias with regards to TSS (i.e., is there a significant association between patient sex and physician diagnosis of TSS)? Why or why not? Explain.
» fisher.test(DiagBias) Fisher s Exact Test for Count Data » assocstats(DiagBias)Sphi 11 0.6093909 data: DiagBias p-value
Homework Answers
Answer:
1. Please refer below screenshot for the Odds ratio:

As per obtained Odds-ratio i.e. 18.74 , which >1 so we can say here Physician's TSS diagnosis for female patients is much larger than TSS diagnosis for male patient.
B.
The confidence interval indicates the level of uncertainty around the measure of effect (precision of the effect estimate) which in this case is expressed as an Odds- Ratio. Confidence intervals are used because a study recruits only a small sample of the overall population so by having an upper and lower confidence limit we can infer that the true population effect lies between these two points
We have C.I for given population is [13.07, 26.89] and our O-R value is 18.74 which lies between obtain 95% Confidence Interval.
Hence here is 95% probability that CI estimate have truly contains the population parameter.
C.
We have got the 95% C.I for given population parameter is [13.07, 26.89]. which indicates 95 out of 100 times our population parameter belongs from this Confidence interval.
D.
We have,
Null Hypothesis : Ho: There is no significant difference between odds of a physician diagnosing TSS between female patients and male patients.
V/S
Alternative Hypothesis : H1: There is significant difference between odds of a physician diagnosing TSS between female patients and male patients.
As per given R output we have p value i.e. 2.2e^-16, since this P-value is much smaller than the 5 % level of significance i.e.0.05, so we may accept alternate hypothesis and reject null hypothesis.
So we can conclude that there is statistically significant difference between odds of a physician diagnosing TSS between female patients and male patients.
Association :
Also obtained R ( Association Phi) value is greater than 0 so there is positive correlation between patient sex and physician diagnosis of TSS but not perfect positive correlation.
So we can say, there is considerable correlation/association between patient sex and physician diagnosis of TSS.
Add Answer to:
Toxic shock syndrome (TSS) is a severe illness associated with infections. While anyone can devel...
Most questions answered within 3 hours.
-
Calculate the number density of argon gas at a temperature of
24C and a pressure of...
asked 1 hour ago -
Alternative
Classification
How to Estimate
Probabilities from Data? ( For continuous Attributes)
And How to generate...
asked 1 hour ago -
An explosion breaks a 20.0-kg object into three parts. The
object is initially moving at a...
asked 2 hours ago -
Calculate the approximate number of residues of Rubisco, which
is involved in carbon fixation in plants,...
asked 3 hours ago -
Other decisions about scientific claims can have a much broader
impact.ENERGYarrow-10x10.png, environment, health, security - all...
asked 4 hours ago -
I need to write a research paper and work cited about this
topic: The United States...
asked 5 hours ago -
Hello! I was wondering if I could have some help?
If the vapor pressure of carvone...
asked 5 hours ago -
An economist wants to estimate the mean per capita income (in
thousands of dollars) for a...
asked 5 hours ago -
What would be the input/output characteristic of a circuit
obtained by putting two of your 2's-complementers...
asked 5 hours ago -
In Drosophila, the transition from the syncytial blastoderm
stage to the cellular blastoderm stage is a...
asked 6 hours ago -
Project management question:
Name 3 different types of resources (hint: humans are one
type)
asked 6 hours ago -
Consider the following reaction: C 2H 2( g) + 2H 2( g) C 2H 6(
g)...
asked 6 hours ago