
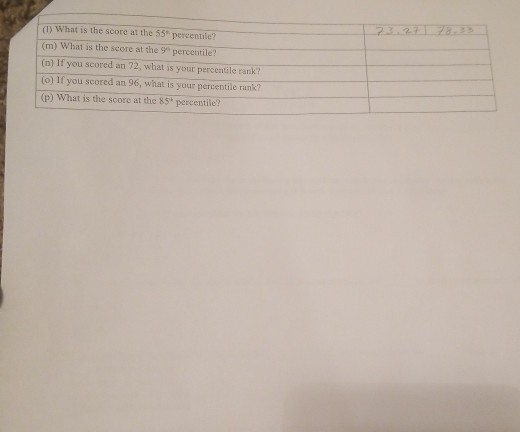
(l) what is the score at the 55% percentile? (m) What is the score at the 9" percentile? (n) If you scored an 72, what is your percentile rank? o) If you scored an 96, what is your percentlie rank? (p) What is the score at the 85* percentile?
Homework Answers

Add Answer to:
For Test #i in a undergraduate statistics course, 191 students completed the exam. The mean score...
For Test #1 in an undergraduate statistics course, 191 students completed the exam. The mean score...
For Test #1 in an undergraduate statistics course, 191 students completed the exam. The mean score was 75.8, and the standard deviation was 10.0. This is pretend data. Using this data and the z-score distribution provided in class, answer the following questions. Be sure to give your answer in the units requested. Report all answers to two decimal places if answer involves decimals. -I mostly need help with (e-p), but it would still help to go over (a-d). (a) How...
Scores on the the first exam in an introductory statistics course for 12 students. 55, 63,...
Scores on the the first exam in an introductory statistics course for 12 students. 55, 63, 70, 73, 75, 80, 83, 85, 87, 90, 93, 98 Find the percentile of the score 70 Find the score that corresponds 53 percentile Find the score that corresponds 60 percentile
The final exam scores of students taking a statistics course are normally distributed with a population...
 The final exam scores of students taking a statistics course are normally distributed with a population mean of 72 and a population standard deviation of 8. If a student taking this statistics course is randomly selected, what is the probability that his/her final exam score is between 60 and 84? A .4332 .9332 C .8664 .1336 Submit Answer
For statistics expert The data in the table are simulated exam scores. Suppose the exam was...
 For statistics expert
The data in the table are simulated exam scores. Suppose the exam was given in the semester after the course content was revised, and the previous mean exam score was 70. We would like to know whether or not the mean score has increased. Answer the following question using any approximate method by stating the necessary assumptions. The data are here: Simulated Exam Scores 75 70 88 80 80 66 65 68 85 80 78 72 69...
For statistics expert
The data in the table are simulated exam scores. Suppose the exam was given in the semester after the course content was revised, and the previous mean exam score was 70. We would like to know whether or not the mean score has increased. Answer the following question using any approximate method by stating the necessary assumptions. The data are here: Simulated Exam Scores 75 70 88 80 80 66 65 68 85 80 78 72 69...
The average final exam score for the statistics course is 74%. A professor wants to see...
 The average final exam score for the statistics course is 74%. A professor wants to see if the average final exam score for students who are given colored pens on the first day of class is different. The final exam scores for the 16 randomly selected students who were given the colored pens are shown below. Assume that the distribution of the population is normal. 95, 87, 86, 87, 72, 69, 70, 99, 78, 78, 91, 69, 72, 73, 61,...
The average final exam score for the statistics course is 82%. A professor wants to see...
 The average final exam score for the statistics course is 82%. A professor wants to see if the average final exam score for students who are given colored pens on the first day of class is higher. The final exam scores for the 13 randomly selected students who were given the colored pens are shown below. Assume that the distribution of the population is normal. 89, 96, 70, 93, 95, 89, 100, 93, 71, 80, 91, 100, 75 What can...
The average final exam score for the statistics course is 77%. A professor wants to see...
 The average final exam score for the statistics course is 77%. A professor wants to see if the average final exam score for students who are given colored pens on the first day of class is lower. The final exam scores for the 12 randomly selected students who were given the colored pens are shown below. Assume that the distribution of the population is normal. 79.65, 57. 72. 84. 54,60,69.69.85,58,79 What can be concluded at the the a = 0.05...
Solve the problem. 4) 4) The midterm and final exam scores of 10 students in a statistics course ...
 Solve the problem. 4) 4) The midterm and final exam scores of 10 students in a statistics course are observed and re in variable X and Y. The observed data yield (a) Find a (b) Find B. (c) Calculate the least squares regression line frormthese data. (d) If a student's midterm score is 75, what is his predicted final exam score? (e) If one has calculated σ-18, what is the 95% confidence interval for Y when the studen midtern score...
The average final exam score for the statistics course is 75%. A professor wants to see...
 The average final exam score for the statistics course is 75%. A professor wants to see if the average final exam score for students who are given colored pens on the first day of class is lower. The final exam scores for the 15 randomly selected students who were given the colored pens are shown below. Assume that the distribution of the population is normal. 63, 81, 82, 65, 75, 49. 86, 75, 56, 62, 72, 83, 81, 66, 48...
Problem 8. (1 point) Suppose the scores of students on a Statistics course are Normally distributed with a mean of...
 Problem 8. (1 point) Suppose the scores of students on a Statistics course are Normally distributed with a mean of 261 and a standard deviation of 66 What percentage of the students scored between 261 and 391 on the exam? (Give your answer to 3 significant figures) I percent.
 The final exam scores of students taking a statistics course are normally distributed with a population mean of 72 and a population standard deviation of 8. If a student taking this statistics course is randomly selected, what is the probability that his/her final exam score is between 60 and 84? A .4332 .9332 C .8664 .1336 Submit Answer
 For statistics expert
The data in the table are simulated exam scores. Suppose the exam was given in the semester after the course content was revised, and the previous mean exam score was 70. We would like to know whether or not the mean score has increased. Answer the following question using any approximate method by stating the necessary assumptions. The data are here: Simulated Exam Scores 75 70 88 80 80 66 65 68 85 80 78 72 69...
For statistics expert
The data in the table are simulated exam scores. Suppose the exam was given in the semester after the course content was revised, and the previous mean exam score was 70. We would like to know whether or not the mean score has increased. Answer the following question using any approximate method by stating the necessary assumptions. The data are here: Simulated Exam Scores 75 70 88 80 80 66 65 68 85 80 78 72 69...
 The average final exam score for the statistics course is 74%. A professor wants to see if the average final exam score for students who are given colored pens on the first day of class is different. The final exam scores for the 16 randomly selected students who were given the colored pens are shown below. Assume that the distribution of the population is normal. 95, 87, 86, 87, 72, 69, 70, 99, 78, 78, 91, 69, 72, 73, 61,...
 The average final exam score for the statistics course is 82%. A professor wants to see if the average final exam score for students who are given colored pens on the first day of class is higher. The final exam scores for the 13 randomly selected students who were given the colored pens are shown below. Assume that the distribution of the population is normal. 89, 96, 70, 93, 95, 89, 100, 93, 71, 80, 91, 100, 75 What can...
 The average final exam score for the statistics course is 77%. A professor wants to see if the average final exam score for students who are given colored pens on the first day of class is lower. The final exam scores for the 12 randomly selected students who were given the colored pens are shown below. Assume that the distribution of the population is normal. 79.65, 57. 72. 84. 54,60,69.69.85,58,79 What can be concluded at the the a = 0.05...
 Solve the problem. 4) 4) The midterm and final exam scores of 10 students in a statistics course are observed and re in variable X and Y. The observed data yield (a) Find a (b) Find B. (c) Calculate the least squares regression line frormthese data. (d) If a student's midterm score is 75, what is his predicted final exam score? (e) If one has calculated σ-18, what is the 95% confidence interval for Y when the studen midtern score...
 The average final exam score for the statistics course is 75%. A professor wants to see if the average final exam score for students who are given colored pens on the first day of class is lower. The final exam scores for the 15 randomly selected students who were given the colored pens are shown below. Assume that the distribution of the population is normal. 63, 81, 82, 65, 75, 49. 86, 75, 56, 62, 72, 83, 81, 66, 48...
 Problem 8. (1 point) Suppose the scores of students on a Statistics course are Normally distributed with a mean of 261 and a standard deviation of 66 What percentage of the students scored between 261 and 391 on the exam? (Give your answer to 3 significant figures) I percent.
Most questions answered within 3 hours.
-
An entomologist discovers a dung beetle rolling a ball of dung
along the ground, and decides...
asked 1 hour ago -
Humans have used horses for transportation for millions of
years. Therefore, they will use horses for...
asked 3 hours ago -
The following are the Jensen Corporation's unit costs of making
and selling an item at a...
asked 3 hours ago -
Does direct Medicare reimbursement of Advanced practice nurses
increase access to their services?
asked 4 hours ago -
List and explain why a company would choose to use a
published
compensation survey vs. creating...
asked 4 hours ago -
A discrete random variable X can take values from 1 to 10. Find
the variance of...
asked 4 hours ago -
The primary financial goal of a corporation is to maximize:
shareholders wealth.
earnings per share.
stock...
asked 5 hours ago -
determine whether the vectors u=(1,2,3,), v=(-2,1,0) and
w=(1,0,1) are linearly dependent or independent.
asked 5 hours ago -
python
Define a function called print_values which takes a dictionary
object as a parameter. The function...
asked 6 hours ago -
In Chapter 1 you created a program named Triangle in
which you displayed a seven-line triangle...
asked 6 hours ago -
Research question: What are the differences between separately
stated and non separately stated transactions in an...
asked 6 hours ago -
By using Arduino write a code that connects two LEDs to two
push-buttons. Each button controls...
asked 7 hours ago