
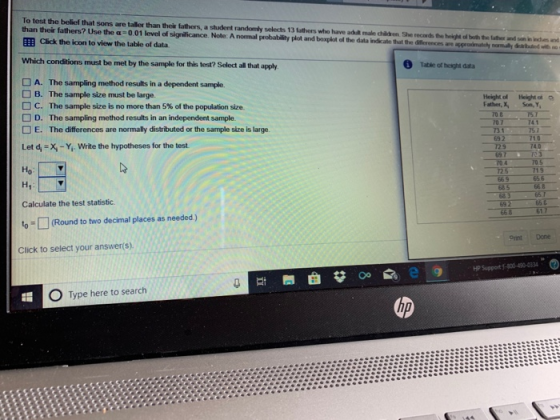


To test the belief that sons are taller than their fathers, a student randomly selects 13 lathors who have adut male child en She records the hekght o both t tahr and s i iehes and than their fathers? Use the a 0.01 level of significance. Note: A normal probability plot and boxpkot of the data indicate that the differences are appradimay omuly EE Click the icon to view the table of data e wh Which conditions must be met by the sample for this test? Select all that apply Tatle of hsght data A. The sampling method results in a dependent sample B. The sample size must be large. □ C. The sample size is no more than 5% of the population size. □ D. The sampling method results in an independent sample. Height of Height Father, X,Son,Y 70 B E. The differences are normally distributed or the sample size is large Let d, X-Y. Write the hypotheses for the test Ho H1 Calculate the test statistic to Round to two decimal places as needed) Click to select your answer(s). 51 697 25 669 70 5 719 65 6 Orint Done HP Support 3-800-490-033 O Type here to search (hp
t athers who have adult male children. She records the height of both the father and son in inches and oblains the following data. Are sons taller and boxplot of the data indicate that the diflerences are approximately normally distributed with no outliers. Table of height data Height of Father, X, 70.8 Height of Son, Y 75.7 70.774 73.1 69.2 72.9 69.7 70.4 2.5 66.9 68.5 68 69.2 66.8 75.7 71.0 74.0 70.3 70.5 65 66.8 65.7 65.8 Print Done 11:31 AM 4/2/2019 0> e i HP Support 1-800-490-0334 (hp
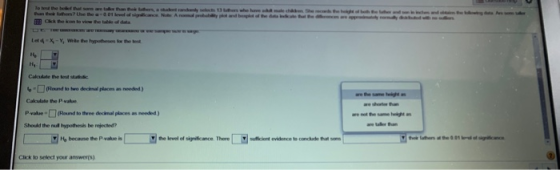
pvalue-□(Round to three decinal places as _ ) Should the nul hypothesis be rejected? are net the same higts H, becase the P.value is the level ef significance. There Click lo select your answerrs)
buat the dierences are approximately normaly dabted wilth o uis III Ckck the icon to view the table of data Which condions must be met by the sample for thi Select all that apply A. The sampling mothod results in a dependond sane B. The sample sire must be large C. The sample seo hnomore than 5% of the popdatin see าณ nw sampleng method nowa.an independant sample n, Calculate the lest statistic Round to tro declmal places as needed) Click to select your answer's)
7170035968787 n 545|1400|15655|1 of x; ,871 2 974595328 68896 6-6-6-6-6 00392902 77767677 9
IB Cik the icon to viow the tabde of data Ho Hi Calcalate the lest statidic いDeland to two dinal places as needed) Cakculate the P value P-value-□(Round to three decinal places as needed ) Should the nul hypothesis be rejected? are the same height as are shorter than are not the same height as are taller than y].6 because the p.value 놈 the level of significance Theresuficient evidence to conckude that sons their lathers at the 01 el of significance Clck to select your answer(s)
Homework Answers
To test  against
Here
sample mean of difference 
sample standard deviation of difference 
and sample size 
The test statistic can be written as
 which under H0 follows a t distribution with n-1 df.
We reject H0 at 1% level of significance if p-value < 0.01
Now,
The value of the test statistic = 
and p-value 
Since p-value > 0.01, so we fail to reject H0 at 1% level of significance. There is not sufficient evidence to conclude that sons are the same height as their fathers at the 0.01 level of significance.
Add Answer to:
Are taller than their tathers, a student randomly selects 13 fathers who have adult male children...
To test the belief that sons are taller than their fathers, a student randomly selects 13...
To test the belief that sons are taller than their fathers, a student randomly selects 13 fathers who have adult male children. She records the height of both the father and son in inches and obtains the following data. Are sons taller than their fathers? Use the alphaαequals=0.050.05 level of significance. Note: A normal probability plot and boxplot of the data indicate that the differences are approximately normally distributed with no outliers. LOADING... Click the icon to view the table...
To test the belief that sons are taller than their fathers, a student randomly selects 13...
 To test the belief that sons are taller than their fathers, a student randomly selects 13 fathers who have adult male children. She records the height of both the father and son in inches and obtains the following data. Are sons taller than their fathers? Use the a = 0.05 level of significance. Note: A normal probability plot and boxplot of the data indicate that the differences are approximately normally distributed with no outliers. Click the icon to view the...
To test the belief that sons are taller than their fathers, a student randomly selects 13...
To test the belief that sons are taller than their fathers, a student randomly selects 13 fathers who have adult male children. She records the height of both the father and son in inches and obtains the following data. Are sons taller than their fathers? Use the α=0.10 level of significance. Note: A normal probability plot and boxplot of the data indicate that the differences are approximately normally distributed with no outliers. Height of Father Height of Son 71.5 ...
To test the belief that sons are taller than their fathers, a student randomly selects 13...
 To test the belief that sons are taller than their fathers, a student randomly selects 13 fathers who have adult male children. She records the height of both the father and son in inches and obtains the following data. Are sons taller than their fathers? Use the a= 0.01 level of significance. Note: A normal probability plot and boxplot of the data indicate that the differences are approximately normally distributed with no outliers. Click here to view the table of...
to test the believe that songs are taller than their fathers a student randomly selects 13...
 to test the believe that songs are taller than their fathers a
student randomly selects 13 fathers who have adult male children
she records the height of both the father and son in inches and
obtains the following data are sons taller than their fathers? use
a=.10 level of significance
Note: normal probability plot in box plot of the data indicate
that the difference are approximately normally distributed with no
outliers
To test the belief that sons are taller than...
to test the believe that songs are taller than their fathers a
student randomly selects 13 fathers who have adult male children
she records the height of both the father and son in inches and
obtains the following data are sons taller than their fathers? use
a=.10 level of significance
Note: normal probability plot in box plot of the data indicate
that the difference are approximately normally distributed with no
outliers
To test the belief that sons are taller than...
To test the belief that sons are taller than their fathers, a student randomly selects 13...
 To test the belief that sons are taller than their fathers, a student randomly selects 13 fathers who have adult male children. She records the height of both the father and son in inches and obtains the following data. Are sons taller than their fathers? Use the a=0.01 level of significance. Note: A normal probability plot and boxplot of the data indicate that the differences are approximately normally distributed with no outliers. Click here to view the table of data....
9. To test the belief that sons are taller than their fathers, a student randomly selects I3 fathers who have adult male children. She records the height of both the father and son in inches and...
 9. To test the belief that sons are taller than their fathers, a student randomly selects I3 fathers who have adult male children. She records the height of both the father and son in inches and obtains the following data: Height of father, X 70.3 67.1 709 66.8 Height of son, Y 74.1 69.2 669 692 689 70.2 70.4 728 70.4 71.8 一81-9 | 10 | 11 | 12 | 13 Height of father, 70.1 69.9 70.8 70.2 704 724...
i need the last question. Question Help To test the belief that sons are taller than...
 i need the last question.
Question Help To test the belief that sons are taller than their fathers, a student randomly selects 13 fathers who have adult male children. She records the height of both the father and son in inches and obtains the following data. Are sons taller than their fathers? Use the x = 0.05 level of significance. Note: A normal probability plot and boxplot of the data indicate that the differences are approximately normally distributed with no...
i need the last question.
Question Help To test the belief that sons are taller than their fathers, a student randomly selects 13 fathers who have adult male children. She records the height of both the father and son in inches and obtains the following data. Are sons taller than their fathers? Use the x = 0.05 level of significance. Note: A normal probability plot and boxplot of the data indicate that the differences are approximately normally distributed with no...
A researcher randomly selects 6 fathers who have adult sons and records the fathers' and sons'...
A researcher randomly selects 6 fathers who have adult sons and records the fathers' and sons' heights to obtain the data shown in the table below. Test the claim that sons are taller than their fathers at the alpha equals 0.10α=0.10 level of significance. The normal probability plot and boxplot indicate that the differences are approximately normally distributed with no outliers so the use of a paired t-test is reasonable. Observation 1 2 3 4 5 6 Height of father...
To test the belief that sons are taller than their fathers, a student ran- domly selects 13 fathe...
 To test the belief that sons are taller than their fathers, a student ran- domly selects 13 fathers who have adult male children. She records the height (in inches) of both the father and the son in the following table. Are sons taller than their fathers? NOTE: A normal probability plot indicated that the differences (X -Y) are approximately normally distributed with no outliers. 70.4 71.8 70.1 70.2 70.4 69.3 eight of Father, Y eight of Son, X eight of...
 To test the belief that sons are taller than their fathers, a student randomly selects 13 fathers who have adult male children. She records the height of both the father and son in inches and obtains the following data. Are sons taller than their fathers? Use the a = 0.05 level of significance. Note: A normal probability plot and boxplot of the data indicate that the differences are approximately normally distributed with no outliers. Click the icon to view the...
 To test the belief that sons are taller than their fathers, a student randomly selects 13 fathers who have adult male children. She records the height of both the father and son in inches and obtains the following data. Are sons taller than their fathers? Use the a= 0.01 level of significance. Note: A normal probability plot and boxplot of the data indicate that the differences are approximately normally distributed with no outliers. Click here to view the table of...
 to test the believe that songs are taller than their fathers a
student randomly selects 13 fathers who have adult male children
she records the height of both the father and son in inches and
obtains the following data are sons taller than their fathers? use
a=.10 level of significance
Note: normal probability plot in box plot of the data indicate
that the difference are approximately normally distributed with no
outliers
To test the belief that sons are taller than...
to test the believe that songs are taller than their fathers a
student randomly selects 13 fathers who have adult male children
she records the height of both the father and son in inches and
obtains the following data are sons taller than their fathers? use
a=.10 level of significance
Note: normal probability plot in box plot of the data indicate
that the difference are approximately normally distributed with no
outliers
To test the belief that sons are taller than...
 To test the belief that sons are taller than their fathers, a student randomly selects 13 fathers who have adult male children. She records the height of both the father and son in inches and obtains the following data. Are sons taller than their fathers? Use the a=0.01 level of significance. Note: A normal probability plot and boxplot of the data indicate that the differences are approximately normally distributed with no outliers. Click here to view the table of data....
 9. To test the belief that sons are taller than their fathers, a student randomly selects I3 fathers who have adult male children. She records the height of both the father and son in inches and obtains the following data: Height of father, X 70.3 67.1 709 66.8 Height of son, Y 74.1 69.2 669 692 689 70.2 70.4 728 70.4 71.8 一81-9 | 10 | 11 | 12 | 13 Height of father, 70.1 69.9 70.8 70.2 704 724...
 i need the last question.
Question Help To test the belief that sons are taller than their fathers, a student randomly selects 13 fathers who have adult male children. She records the height of both the father and son in inches and obtains the following data. Are sons taller than their fathers? Use the x = 0.05 level of significance. Note: A normal probability plot and boxplot of the data indicate that the differences are approximately normally distributed with no...
i need the last question.
Question Help To test the belief that sons are taller than their fathers, a student randomly selects 13 fathers who have adult male children. She records the height of both the father and son in inches and obtains the following data. Are sons taller than their fathers? Use the x = 0.05 level of significance. Note: A normal probability plot and boxplot of the data indicate that the differences are approximately normally distributed with no...
 To test the belief that sons are taller than their fathers, a student ran- domly selects 13 fathers who have adult male children. She records the height (in inches) of both the father and the son in the following table. Are sons taller than their fathers? NOTE: A normal probability plot indicated that the differences (X -Y) are approximately normally distributed with no outliers. 70.4 71.8 70.1 70.2 70.4 69.3 eight of Father, Y eight of Son, X eight of...
Most questions answered within 3 hours.
-
What is facilitated diffusion and how does it differ from
symport and antiport transportation? How do...
asked 4 minutes ago -
if a firm producing 100 units at $5.00 each experience
an 80% experience curve, what will...
asked 41 minutes ago -
A solid, uniform disk of radius 0.250 m and mass 53.7 kg rolls
down a ramp...
asked 3 hours ago -
Given the following table of high speed internet access vs.
annual home income:
Home Income
%...
asked 3 hours ago -
A baseball batter hits a 0.145kg baseball straight up into the
air. The baseball leaves the...
asked 4 hours ago -
An FM modulator is tested using
single-tone baseband signal with frequency of 50kHz and a sprectrum...
asked 4 hours ago -
Write the ionic equations for the first stage of salts
hydrolysis.
Anion, Cation?
Na2S
NiSO4
K2SO4...
asked 5 hours ago -
suppose there is a normally distributed population with a mean of
250 and a standard deviation...
asked 6 hours ago -
Question Three
Suppose you as project manager are using the Waterfall
development methodology on a large...
asked 7 hours ago -
Which statement is not true about welfare in Canada?
A.Benefits typically vary based on one's ability...
asked 8 hours ago -
Please help me with FLOWCHART and UML diagram for class,
thank you!
#include <iostream>
#include <fstream>...
asked 8 hours ago -
3. Describe the “logic circuit” of the Lac operon. Which
proteins are bound or not to...
asked 8 hours ago