Assignment #5: Analysis of Variance and Post Hoc Tests Directions: Using the information from the...
Assignment #5: Analysis of Variance and Post Hoc Tests Directions: Using the information from the following scenario, conduct a one-way ANOVA and specify the LSD post hoc test. The superintendent is continuing to examine the data that has been reported for the district. Another question concerned the differences in performance on high stakes tests. To examine this issue, the superintendent obtained the average scale scores for schools that participated in the high stakes testing for the district and two comparison districts. The following scores were collected: Superintendent’s district: 281 301 297 312 344 306 326 279 306 317 299 302 Comparison district 1: 328 290 302 275 293 291 289 286 288 291 291 310 Comparison district 2: 283 279 274 304 291 278 271 304 269 281 291 278 1. What is the mean scale score for each district? 2. What is the standard deviation of the scale scores for each district? 3. State an appropriate null hypothesis for this analysis. 4. What is the observed or computed value of F? 5. What are the reported degrees of freedom for the Between Groups variance? 6. What are the reported degrees of freedom for the Within Groups variance? 7. What is the reported level of significance? 8. Based on the results of the one-way ANOVA, would you accept or reject the null hypothesis? 9. Based on the results of the LSD post hoc test, identify which districts are significantly different. 10. Present the results as they might appear in an article. This must include a table and narrative statement that reports the results of the one-way ANOVA and LSD post hoc test. I also need to know how to enter it into the SPSS Calculator
Homework Answers
Answwer:
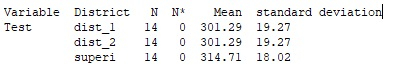
Answers to question 1 and 2.
3) Ans:
Null hypothesis: The mean scores between each district are same.
Alternative Hypothesis: At least one district has difference mean score.
4)

The observed or computed value of F is 2.365.
5) Ans: The reported degrees of freedom for the Between Groups variance is 3-1=2.
6) Ans: The reported degrees of freedom for the Within Groups variance is 39.
7) Ans: The reported level of significance is 0.05 (standard).
8) Ans: Based on the results of the one-way ANOVA, we should accept the null hypothesis. Because the estimated p-value is 0.107 and larger than 0.05 level of significance.
9)
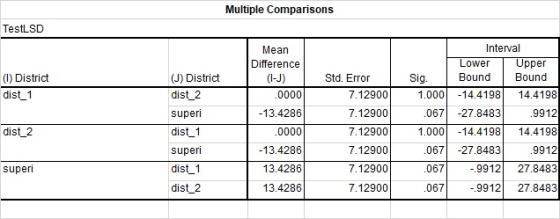
From 8 we know that there is no significant difference in mean scores. Hence, the LSD post hoc test can not identify which districts are significantly different at 0.05 level of significance.
Add Answer to:
Assignment #5: Analysis of Variance and Post Hoc Tests Directions: Using the information from the...
SPSS Lab Assignment #2 Output Analysis One Descriptives Depression_13 2323 WHITE BLACK AMER IND ASIAN HISPAN...
 SPSS Lab Assignment #2 Output Analysis One Descriptives Depression_13 2323 WHITE BLACK AMER IND ASIAN HISPAN Mean 10.0010 10.0930 10.1038 10.1060 10.1062 10.0343 Std. Deviation 24975 27993 25361 27124 27267 26409 95% Confidence interval for Mean Std. ErrorLower Bound Upper Bound 00518 9.9908 10.0111 .00817 10.0770 10.1090 .03699 10.0294 10.1783 04952 10.0047 10.2073 .04158 10.0223 10.1901 00439 10.0257 10.0429 30 43 3617 Total ANOVA Depression 73 Mean Square Sum of Squares 7.230 244.967 1.808 26.651 Between Groups Within Groups Total...
 SPSS Lab Assignment #2 Output Analysis One Descriptives Depression_13 2323 WHITE BLACK AMER IND ASIAN HISPAN Mean 10.0010 10.0930 10.1038 10.1060 10.1062 10.0343 Std. Deviation 24975 27993 25361 27124 27267 26409 95% Confidence interval for Mean Std. ErrorLower Bound Upper Bound 00518 9.9908 10.0111 .00817 10.0770 10.1090 .03699 10.0294 10.1783 04952 10.0047 10.2073 .04158 10.0223 10.1901 00439 10.0257 10.0429 30 43 3617 Total ANOVA Depression 73 Mean Square Sum of Squares 7.230 244.967 1.808 26.651 Between Groups Within Groups Total...
Most questions answered within 3 hours.
-
1. In the short run, the marginal product of labor increases
then decreases because of what?...
asked 20 minutes ago -
A farmer wants to compare the tastiness and juiciness of
tomatoes grown with three amounts of...
asked 1 hour ago -
What is facilitated diffusion and how does it differ from
symport and antiport transportation? How do...
asked 1 hour ago -
if a firm producing 100 units at $5.00 each experience
an 80% experience curve, what will...
asked 2 hours ago -
A solid, uniform disk of radius 0.250 m and mass 53.7 kg rolls
down a ramp...
asked 4 hours ago -
Given the following table of high speed internet access vs.
annual home income:
Home Income
%...
asked 5 hours ago -
A baseball batter hits a 0.145kg baseball straight up into the
air. The baseball leaves the...
asked 5 hours ago -
An FM modulator is tested using
single-tone baseband signal with frequency of 50kHz and a sprectrum...
asked 6 hours ago -
Write the ionic equations for the first stage of salts
hydrolysis.
Anion, Cation?
Na2S
NiSO4
K2SO4...
asked 7 hours ago -
suppose there is a normally distributed population with a mean of
250 and a standard deviation...
asked 8 hours ago -
Question Three
Suppose you as project manager are using the Waterfall
development methodology on a large...
asked 9 hours ago -
Which statement is not true about welfare in Canada?
A.Benefits typically vary based on one's ability...
asked 9 hours ago