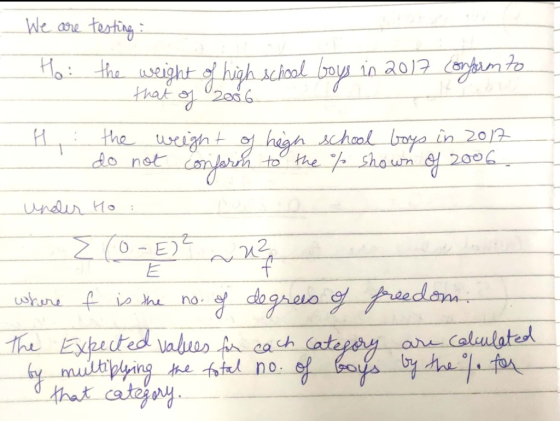
Researchers have hypothesized that the distribution of the weight categories (underweight, normal...
Researchers have hypothesized that the distribution of the weight categories (underweight, normal, overweight\obese) of high school boys is changing over time. In 2006, the proportion of a large sample of high school boys was collected in 2006, resulting in the following proportions (Table 1):
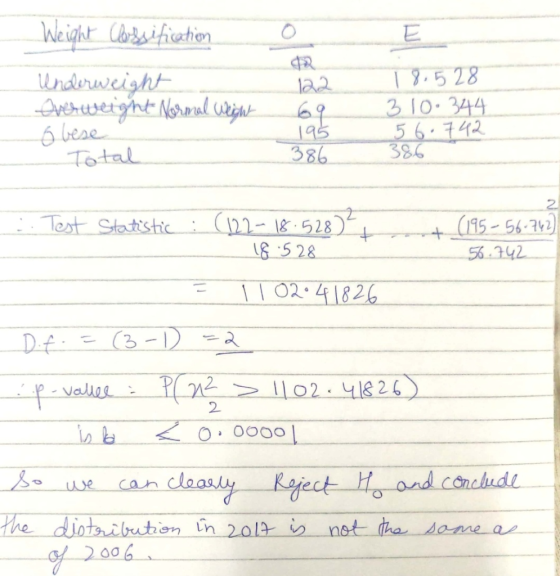
Table 1: Distribution of weights of high school boys 2006
|
Weight classification (BMI range) |
Proportion of high school boys |
|
Underweight (<18 kg/m2) |
4.8% |
|
Normal weight (18-25 kg/m2) |
80.4% |
|
Overweight/obese (>25 kg/m2) |
14.7% |
In 2017, researchers classified 386 high school boys into the same categories and found the following counts (table2):
Table 2. Distribution of weight of high school boys 2017 (counts)
|
Weight classification (BMI range) |
Number of high school boys |
|
Underweight (<18 kg/m2) |
122 |
|
Normal weight (18-25 kg/m2) |
69 |
|
Overweight/obese (>25 kg/m2) |
195 |
What test would be used to assess if the distribution of weight of high school boys was the same in 2017 as it was in 2006? Perform the test, stating the hypotheses, reporting the test statistic and p-value and interpret your result.
Homework Answers
Chi square goodness of fit test would be used to assess if the distribution of weight of high school boys was the same in 2017 as it was in 2006.
Add Answer to:
Researchers have hypothesized that the distribution of the weight categories (underweight, normal...
Health Promotion It is fairly well known that perception of weight by adoles- cents does not...
 Health Promotion It is fairly well known that perception of weight by adoles- cents does not always agree with actual weight. What is less clear is whether perception of weight differs by gender. For this purpose, a study was performed among students in a local high school, where students provided their actual height and weight by self-report. The following data were obtained from 286 students (143 boys and 143 girls). (The data for this problem were provided by Laura Rosner.)...
The following table shows the numbers of patients classified as underweight, normal weight, overweight and obese...
The following table shows the numbers of patients classified as underweight, normal weight, overweight and obese according to their diabetes status. Underweight Normal Weight Overweight Obese Diabetes 8 34 65 43 No Diabetes 12 85 93 40 1. What proportion of patients is both obese and diabetic?
0/2 pts correct Question 17 A BMI of 30 is considered O underweight o normal weight...
 0/2 pts correct Question 17 A BMI of 30 is considered O underweight o normal weight O overweight O obese
5. A person's Body-Mass Index (BMI) is calculated by dividing weight (in kilograms) by height2 (in...
 5. A person's Body-Mass Index (BMI) is calculated by dividing weight (in kilograms) by height2 (in meters). According to the book, The Changing Body, the BMI values of non-Hispanic adult males in the United States are approximately Normally distributed with mean (μ)-265 and standard deviation (o)-4.0. Find the standardized scores associated with the thresholds between different categories. a. Underweight vs. Normal (BMI 18.5) b. Normal vs. Overweight (BMI 25) c. Overweight vs. Obese (BMI 30) 6. Combine the standardized scores...
7. Below is a drawing of a Standard Normal Distribution, a bell-curve density function. Vertical lines...
7. Below is a drawing of a Standard Normal Distribution, a bell-curve density function. Vertical lines have been drawn for every half of a standard deviation away from the mean. Illustrate the calculations you performed in question 6 as follows: [a] draw a vertical line that divides “underweight” and “normal” weights (i.e., BMI = 18.5), [b] draw a vertical line that divides “normal” weight and “overweight” (i.e., BMI = 25), [c] draw a vertical line that divides “overweight” and “obese”...
Write a Java program that performs these operations Prompt the user to enter a low height...
 Write a Java program that performs these operations Prompt the user to enter a low height in feet (an integer) Prompt the user to enter a high height in feet (an integer) Prompt the user to enter a low weight in pounds (an integer) Prompt the user to enter a high weight in pounds (an integer) Print a table of Body Mass Index (BMI) for the heights and weights entered, ranging from the low height to the high height (inclusive),...
Write a C program that reads the height and weight of a person and calculates the...
Write a C program that reads the height and weight of a person and calculates the body mass index (bmi) according to formula bmi = weight/(height)2. Your program should display a qualitative assessment of the weight according to the following table: BMI value Letter Grade [0-20) Below normal weight [20-25) Normal weight [25-30) Overweight >=30 Obese Sample Output: Enter your weight in kilos: 70 Enter your height in meters: 1.80 Result: Normal weight Test values: (70 1.8) (50, 1.9) (90,...
A researcher created three groups based on participants BMI: normal weight, overweight and obese. The hypothesis...
A researcher created three groups based on participants BMI: normal weight, overweight and obese. The hypothesis being tested is that the three groups differ in the mean number of artificially sweetened drinks consumed weekly. Which statistical test might the researcher use, assuming a reasonable normal distribution of values? Group of answer choices One way ANOVA A chi-squared test An independent group t test A repeated measures ANOVA
read instructions carefully please matlab only Write a MATLAB function for a BMI calculator that receives the inputs for body weight (lbs)and height (ft) from the user's program, calculates th...
 read instructions carefully please matlab only
Write a MATLAB function for a BMI calculator that receives the inputs for body weight (lbs)and height (ft) from the user's program, calculates the BMI using the equation below, displays the BMI category, and outputs the BMI value tothe user's program W (kg) h2 (m2) BMI Display Normal if 18.5 s BMI 25 Display Overweight if 25 s BMI <30 Display Obese if BMI 2 30 Else display underweight So you will create two...
read instructions carefully please matlab only
Write a MATLAB function for a BMI calculator that receives the inputs for body weight (lbs)and height (ft) from the user's program, calculates the BMI using the equation below, displays the BMI category, and outputs the BMI value tothe user's program W (kg) h2 (m2) BMI Display Normal if 18.5 s BMI 25 Display Overweight if 25 s BMI <30 Display Obese if BMI 2 30 Else display underweight So you will create two...
Ardith Brunt and coworkers surveyed 557 undergraduate college students to examine their weight status, health behaviors,...
 Ardith Brunt and coworkers surveyed 557 undergraduate college students to examine their weight status, health behaviors, and diet. Using body mass index (BMI), they classified the students into four categories: underweight healthy weight, overweight, and obese. They also measured dietary variety by counting the number of different foa ach student ate from several food groups. Note that the researchers were not measuring the amount of food eate but rather the number of different foods eaten (variety, not quantity). Nonetheless, it...
 Health Promotion It is fairly well known that perception of weight by adoles- cents does not always agree with actual weight. What is less clear is whether perception of weight differs by gender. For this purpose, a study was performed among students in a local high school, where students provided their actual height and weight by self-report. The following data were obtained from 286 students (143 boys and 143 girls). (The data for this problem were provided by Laura Rosner.)...
 0/2 pts correct Question 17 A BMI of 30 is considered O underweight o normal weight O overweight O obese
 5. A person's Body-Mass Index (BMI) is calculated by dividing weight (in kilograms) by height2 (in meters). According to the book, The Changing Body, the BMI values of non-Hispanic adult males in the United States are approximately Normally distributed with mean (μ)-265 and standard deviation (o)-4.0. Find the standardized scores associated with the thresholds between different categories. a. Underweight vs. Normal (BMI 18.5) b. Normal vs. Overweight (BMI 25) c. Overweight vs. Obese (BMI 30) 6. Combine the standardized scores...
 Write a Java program that performs these operations Prompt the user to enter a low height in feet (an integer) Prompt the user to enter a high height in feet (an integer) Prompt the user to enter a low weight in pounds (an integer) Prompt the user to enter a high weight in pounds (an integer) Print a table of Body Mass Index (BMI) for the heights and weights entered, ranging from the low height to the high height (inclusive),...
 read instructions carefully please matlab only
Write a MATLAB function for a BMI calculator that receives the inputs for body weight (lbs)and height (ft) from the user's program, calculates the BMI using the equation below, displays the BMI category, and outputs the BMI value tothe user's program W (kg) h2 (m2) BMI Display Normal if 18.5 s BMI 25 Display Overweight if 25 s BMI <30 Display Obese if BMI 2 30 Else display underweight So you will create two...
read instructions carefully please matlab only
Write a MATLAB function for a BMI calculator that receives the inputs for body weight (lbs)and height (ft) from the user's program, calculates the BMI using the equation below, displays the BMI category, and outputs the BMI value tothe user's program W (kg) h2 (m2) BMI Display Normal if 18.5 s BMI 25 Display Overweight if 25 s BMI <30 Display Obese if BMI 2 30 Else display underweight So you will create two...
 Ardith Brunt and coworkers surveyed 557 undergraduate college students to examine their weight status, health behaviors, and diet. Using body mass index (BMI), they classified the students into four categories: underweight healthy weight, overweight, and obese. They also measured dietary variety by counting the number of different foa ach student ate from several food groups. Note that the researchers were not measuring the amount of food eate but rather the number of different foods eaten (variety, not quantity). Nonetheless, it...
Most questions answered within 3 hours.
-
A developmental psychologist believes that children raised in
bilingual families will have higher verbal fluency at...
asked 4 minutes ago -
A fast food meal has 5660 kJ of energy. A person uses energy at
a rate...
asked 16 minutes ago -
The pKb for a generic amine(R-NH2)) in
aqueous solution is 6.30. What is its pKa?
asked 18 minutes ago -
The following reactions have the indicated equilibrium constants
at a particular temperature: N2(g) + O2(g) ⇌...
asked 20 minutes ago -
Please Help ASAP.
1Consider the below code which iterates over a linked
list of n nodes...
asked 36 minutes ago -
Determine the air to fuel ratio of:
Canadian natural gas, with 93.9% methane, 4.2% ethane, 0.3%...
asked 37 minutes ago -
A manufacturer of power tools claims that the average amount of
time required to assemble their...
asked 39 minutes ago -
"electron-withdrawing substituents on carbon encourage back
donation", then on the next page he says that "greater...
asked 50 minutes ago -
On December 31, 2016, the shareholders’ equity section of the
balance sheet of R & L...
asked 59 minutes ago -
16.7
At t=0s a small "upward" (positive y) pulse centered at x = 5.0
m is...
asked 1 hour ago -
Twitter Users and News: A poll conducted in 2013 found that 52%
of U.S. adult Twitter...
asked 1 hour ago -
How
would I know whether a given amino acid has an ionizable group or
not? please...
asked 1 hour ago