
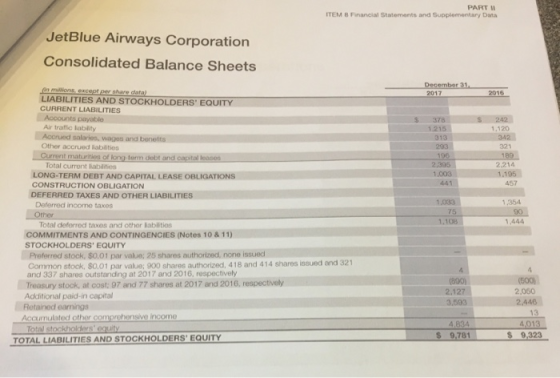

PART I ITEM B Financial Statements and Supplementary Data JetBlue Airways Corporation Consolidated Balance Sheets December 31 n miovns, except per share datal LIABILITIES AND STOCKHOLDERS' EQUITY CURRENT LIABILITIES ts payable 378 Air traffic lablity Accrued salaries, wages and benelits Other accrued iabilties 215 1.120 313 293 321 Current maturities of long terdebt and capital los Total current liabilities LONG-TERM DEBT AND CAPITAL LEASE OBLIGATIONS CONSTRUCTION OBLIGATION 2,395 1,003 2,214 1,195 457 441 DEFERRED TAXES AND OTHER LIABILITIES 033 75 Deferred income taxes 1,354 Other 1.108 1,444 Total deferred taxes and other labilitios COMMITMENTS AND CONTINGENCIES (Notes 10&11) STOCKHOLDERS' EQUITY Preferred stock, $0.01 par value: 25 shares authorized none issued Common stock, $0.01 par value; 900 shares authorized, 418 and 414 shares issued and 321 and 337 shares outstanding at 2017 and 2016, respectively Treasury stock, at cost: 97 and 77 shares at 2017 and 2016, respectively Additional paid-in capital Retained earnings Accumulated other comprehensive income (800) 2.127 3,503 (500) 2,050 2.446 4,834 9,781 stockholders S 9.323 TOTAL LIABILITIES AND STOCKHOLDERS' EQUITY
JetBlue Airways Corporation onsolidated Statements of Operations a milions.except per share amounts Years Ended December 31 2017 OPERATING REVENUES Passenger Other $ 5,893 S 6,013 619 6.632 6.288 Total oporating revenues .015 6,416 OPERATING EXPENSES ircraft fuel and relatod taxes Saleries, wages and benofits Landing fees and other rents Depreciation and Aircraft rent Sales and marketing Maintenance, materials and repairs Other operating expenses 1,348 1.540 342 345 1,074 1,887 397 1.698 357 393 122 259 583 267 490 5,200 1.216 5,320 Total operating expenses OPERATING INCOME OTHER INCOME (EXPENSE 1,000 (128) (95) 10 nterest expense Capitalized interest terest income and other (119) (96) 457 $ 759 Total other income (expensel INCOME BEFORE INCOME TAXES 021 420 677 S 1,147 S NET INCOME $ 3,492.32 S 2.22 $ 2.15 1,98 EARNINGS PER COMMON SHARE Basic Diuted
Homework Answers
| DECEMBER 31 | ||||||
| 2017 | As % | 2016 | As % | |||
| ASSETS | $ | $ | ||||
| CURRENT ASSETS | ||||||
| Cash and Cash Equivalents | 303.00 | 3.10 | 433.00 | 4.64 | ||
| Investment Securities | 390.00 | 3.99 | 538.00 | 5.77 | ||
| Receivables, less allowance (2017-$1; 2016-$5) | 245.00 | 2.50 | 172.00 | 1.84 | ||
| Inventories, less allowance (2017-$14; 2016-$12) | 55.00 | 0.56 | 47.00 | 0.50 | ||
| Prepaid expenses and other | 213.00 | 2.18 | 213.00 | 2.28 | ||
| Total Current Assets | 1206.00 | 12.33 | 1403.00 | 15.05 | ||
| PROPERTY AND EQUIPMENT | ||||||
| Flight equipment | 8980.00 | 91.81 | 7868.00 | 84.39 | ||
| Predelivery deposits for flight equipment | 204.00 | 2.09 | 223.00 | 2.39 | ||
| Total flight equipment and predelivery deposits, gross | 9184.00 | 93.90 | 8091.00 | 86.79 | ||
| Less accumulated depreciation | 2125.00 | 21.73 | 1823.00 | 19.55 | ||
| Total flight equipment and predelivery deposits, net | 7059.00 | 72.17 | 6268.00 | 67.23 | ||
| Other property and equipment | 1041.00 | 10.64 | 972.00 | 10.43 | ||
| Less accumulated depreciation | 405.00 | 4.14 | 345.00 | 3.70 | ||
| Total other property and equipment, net | 636.00 | 6.50 | 627.00 | 6.73 | ||
| Assets constructed for others | 561.00 | 5.74 | 561.00 | 6.02 | ||
| Less accumulated depreciation | 207.00 | 2.12 | 185.00 | 1.98 | ||
| Total assets constructed for others, net | 354.00 | 3.62 | 376.00 | 4.03 | ||
| Total property and equipment, net | 8049.00 | 82.29 | 7271.00 | 77.99 | ||
| OTHER ASSETS | ||||||
| Investment securities | 2.00 | 0.02 | 90.00 | 0.97 | ||
| Restricted cash | 56.00 | 0.57 | 62.00 | 0.67 | ||
| Other | 468.00 | 4.78 | 497.00 | 5.33 | ||
| Total other assets | 526.00 | 5.38 | 649.00 | 6.96 | ||
| TOTAL ASSETS | 9781.00 | 100.00 | 9323.00 | 100.00 | ||
| LIABILITIES AND STOCKHOLDERS’ EQUITY | ||||||
| CURRENT LIABILITIES | ||||||
| Accounts payable | 378.00 | 3.86 | 242.00 | 2.60 | ||
| Air Traffic liability | 1215.00 | 12.42 | 1120.00 | 12.01 | ||
| Accrued salaries, wages and benefits | 313.00 | 3.20 | 342.00 | 3.67 | ||
| Other accrued liabilities | 293.00 | 3.00 | 321.00 | 3.44 | ||
| Current maturities of long-term debt and capital leases | 196.00 | 2.00 | 189.00 | 2.03 | ||
| Total current liabilities | 2395.00 | 24.49 | 2214.00 | 23.75 | ||
| LONG-TERM DEBT AND CAPITAL LEASE OBLIGATIONS | 1003.00 | 10.25 | 1195.00 | 12.82 | ||
| CONSTRUCTION OBLIGATION | 441.00 | 4.51 | 457.00 | 4.90 | ||
| DEFERRED TAXES AND OTHER LIABILITIES | ||||||
| Deferred income taxes | 1033.00 | 10.56 | 1354.00 | 14.52 | ||
| Other | 75.00 | 0.77 | 90.00 | 0.97 | ||
| Total deferred taxes and other liabilities | 1108.00 | 11.33 | 1444.00 | 15.49 | ||
| COMMITMENTS AND CONTINGENCIES (Notes 10 & 11) | ||||||
| STOCKHOLDERS’ EQUITY | ||||||
| Preferred stock, $0.01 par value; 25 shares authorized, none issued | ||||||
| Common stock, $0.01 par value; 900 shares authorized, 418 and 414 shares issued and 321 and 337 shares outstanding at 2017 and 2016, respectively | 4.00 | 0.04 | 4.00 | 0.04 | ||
| Treasury stock, at cost; 97 and 77 shares at 2017 and 2016, respectively | -890.00 | -9.10 | -500.00 | -5.36 | ||
| Additional paid-in capital | 2127.00 | 21.75 | 2050.00 | 21.99 | ||
| Retained earnings | 3593.00 | 36.73 | 2446.00 | 26.24 | ||
| Accumulated other comprehensive income | 13.00 | 0.14 | ||||
| Total stockholders’ equity | 4834.00 | 49.42 | 4013.00 | 43.04 | ||
| TOTAL LIABILITIES AND STOCKHOLDERS’ EQUITY | 9781.00 | 100.00 | 9323.00 | 100.00 | ||
| 2017 | As % | 2016 | As % | 2015 | As % | |
| OPERATING REVENUES | $ | $ | $ | |||
| Passenger | 6288.00 | 89.64 | 6013.00 | 90.67 | 5893.00 | 91.85 |
| Other | 727.00 | 10.36 | 619.00 | 9.33 | 523.00 | 8.15 |
| Total operating revenues | 7015.00 | 100.00 | 6632.00 | 100.00 | 6416.00 | 100.00 |
| OPERATING EXPENSES | ||||||
| Aircraft fuel and related taxes | 1363.00 | 19.43 | 1074.00 | 16.19 | 1348.00 | 21.01 |
| Salaries, wages and benefits | 1887.00 | 26.90 | 1698.00 | 25.60 | 1540.00 | 24.00 |
| Landing fees and other rents | 397.00 | 5.66 | 357.00 | 5.38 | 342.00 | 5.33 |
| Depreciation and amortization | 446.00 | 6.36 | 393.00 | 5.93 | 345.00 | 5.38 |
| Aircraft rent | 100.00 | 1.43 | 110.00 | 1.66 | 122.00 | 1.90 |
| Sales and marketing | 267.00 | 3.81 | 259.00 | 3.91 | 264.00 | 4.11 |
| Maintenance, materials and repairs | 622.00 | 8.87 | 563.00 | 8.49 | 490.00 | 7.64 |
| Other operating expenses | 933.00 | 13.30 | 866.00 | 13.06 | 749.00 | 11.67 |
| Total operating expenses | 6015.00 | 85.74 | 5320.00 | 80.22 | 5200.00 | 81.05 |
| OPERATING INCOME | 1000.00 | 14.26 | 1312.00 | 19.78 | 1216.00 | 18.95 |
| OTHER INCOME (EXPENSE) | ||||||
| Interest expense | -95.00 | -1.35 | -111.00 | -1.67 | -128.00 | -2.00 |
| Capitalized interest | 10.00 | 0.14 | 8.00 | 0.12 | 8.00 | 0.12 |
| Interest income and other | 6.00 | 0.09 | 7.00 | 0.11 | 1.00 | 0.02 |
| Total other income (expense) | -79.00 | -1.13 | -96.00 | -1.45 | -119.00 | -1.85 |
| INCOME BEFORE INCOME TAXES | 921.00 | 13.13 | 1216.00 | 18.34 | 1097.00 | 17.10 |
| Income tax expense (benefit) | -226.00 | -3.22 | 457.00 | 6.89 | 420.00 | 6.55 |
| NET INCOME | 1147.00 | 16.35 | 759.00 | 11.44 | 677.00 | 10.55 |
| EARNINGS PER COMMON SHARE | ||||||
| Basic | 3.49 | 2.32 | 2.15 | |||
| Diluted | 3.47 | 2.22 | 1.98 | |||
>The Net Income has been increasing every year
resulting in the increase of Earning Per Share.
Add Answer to:
You are to do a Vertical Analysis (on both the Balance Sheet and Income Statement) for EACH of th...
Would you recommend an investment in this Jet Blue company? (YES or NO)
 Would you recommend an investment in this Jet Blue company? (YES or
NO)
JetBlue Airways Corporation Consolidated Balance Sheets ASSETS CURRENT ASSETs Cash and cash Investment socuritios 538 Recevablos loss allowanoe (2017-$1:2016-s5) 245 47 Inventories, less allowance (2017-$14; 2016-$12) Prepaid exponses and othor 1403 7,868 8.091 Total current assets PROPERTY AND EQUIPMENT 8.980 Flight equipmont 204 .184 Total hight equipment and predolivory dleponits, grons Less accumulated depreciation Total flight equipment and predelivery deposits, net Other property and equipment Less accumulated...
Would you recommend an investment in this Jet Blue company? (YES or
NO)
JetBlue Airways Corporation Consolidated Balance Sheets ASSETS CURRENT ASSETs Cash and cash Investment socuritios 538 Recevablos loss allowanoe (2017-$1:2016-s5) 245 47 Inventories, less allowance (2017-$14; 2016-$12) Prepaid exponses and othor 1403 7,868 8.091 Total current assets PROPERTY AND EQUIPMENT 8.980 Flight equipmont 204 .184 Total hight equipment and predolivory dleponits, grons Less accumulated depreciation Total flight equipment and predelivery deposits, net Other property and equipment Less accumulated...
Complete a vertical and horizontal analysis on both the income statement and balance sheet. use total...
 Complete a vertical and horizontal analysis on both
the income statement and balance sheet. use total assets on the
balance sheet and net sales on the income statement for your
vertical analysis.
Styles Consolidated Statements of 12 Months Ended Earnings (USD $) In Millions, except Per Share data, unless otherwise specified Income Statement (Abstract] NET SALES Cost of Sales Vertical Vertical Horizontal Feb. 01, 2015 Feb. 02, 2014 Analysis Analysis Analysis $83,176 54,222 $78,812 51,422 GROSS PROFIT Operating Expenses: Selling,...
Complete a vertical and horizontal analysis on both
the income statement and balance sheet. use total assets on the
balance sheet and net sales on the income statement for your
vertical analysis.
Styles Consolidated Statements of 12 Months Ended Earnings (USD $) In Millions, except Per Share data, unless otherwise specified Income Statement (Abstract] NET SALES Cost of Sales Vertical Vertical Horizontal Feb. 01, 2015 Feb. 02, 2014 Analysis Analysis Analysis $83,176 54,222 $78,812 51,422 GROSS PROFIT Operating Expenses: Selling,...
Problem 23.1A Horizontal and vertical analysis of income statement and balance sheet. LO 23-1, 23...
 Problem 23.1A Horizontal and vertical analysis of income
statement and balance sheet. LO 23-1, 23-2
The EastTN Company sells computer parts through a retail store
that it operates. The firm’s comparative income statement and
balance sheet for the years 2016 and 2015 are shown below.
1-a.
Complete both a horizontal and a vertical analysis of
comparative income statement for the years 2016 and 2015.
(Round your percentage answers to 1 decimal place. i.e.,
0.123 should be entered as 12.3.)
1-b....
Problem 23.1A Horizontal and vertical analysis of income
statement and balance sheet. LO 23-1, 23-2
The EastTN Company sells computer parts through a retail store
that it operates. The firm’s comparative income statement and
balance sheet for the years 2016 and 2015 are shown below.
1-a.
Complete both a horizontal and a vertical analysis of
comparative income statement for the years 2016 and 2015.
(Round your percentage answers to 1 decimal place. i.e.,
0.123 should be entered as 12.3.)
1-b....
BALANCE SHEET INCOME STATEMENT ** HW DUE *** Need to find these ratios below. Need one for nike and for adidas for 201...
 BALANCE SHEET
INCOME STATEMENT
** HW DUE *** Need to find these ratios below. Need one for nike
and for adidas for 2018 then one for 2019. EVEN if your only able
to do a couple it will be greatly appreciated!
ADIDAS NIKE Breakdown 5/31/2019 5/31/2018 Breakdown 12/31/2018 12/31/2017 v Assets v Assets Current Assets Current Assets Cash vCash Cash And Cash Equivalents 4,466,000 4249,000 Cash And Cash Equivalents 2.629,000 1,598,000 Short Term Investments 197,000 996,000 Short Term Investments 274,000...
BALANCE SHEET
INCOME STATEMENT
** HW DUE *** Need to find these ratios below. Need one for nike
and for adidas for 2018 then one for 2019. EVEN if your only able
to do a couple it will be greatly appreciated!
ADIDAS NIKE Breakdown 5/31/2019 5/31/2018 Breakdown 12/31/2018 12/31/2017 v Assets v Assets Current Assets Current Assets Cash vCash Cash And Cash Equivalents 4,466,000 4249,000 Cash And Cash Equivalents 2.629,000 1,598,000 Short Term Investments 197,000 996,000 Short Term Investments 274,000...
Complete a vertical and horizontal analysis on the tabs labeled "Balance Sheet" and "Income Statement," use total assets on the balance sheet and net sales on the income statement for...
 Complete a vertical and horizontal analysis on the tabs labeled
"Balance Sheet" and "Income Statement," use total assets on the
balance sheet and net sales on the income statement for your
vertical analysis.
Consolidated Balance Sheets (USD $) In Millions, unless o Feb. 01,2015 Vertical AnalysisFeb. 01,2014Vertical AnalysisHorizontal Analysis therwises fied Current Assets: Cash and Cash Equivalents Receivables, net Merchandise Inventories Other Current Assets Total Current Assets $1.723 1484 11079 1016 15302 38.513 $1929 1.398 11,057 895 15,279 39,064 at...
Complete a vertical and horizontal analysis on the tabs labeled
"Balance Sheet" and "Income Statement," use total assets on the
balance sheet and net sales on the income statement for your
vertical analysis.
Consolidated Balance Sheets (USD $) In Millions, unless o Feb. 01,2015 Vertical AnalysisFeb. 01,2014Vertical AnalysisHorizontal Analysis therwises fied Current Assets: Cash and Cash Equivalents Receivables, net Merchandise Inventories Other Current Assets Total Current Assets $1.723 1484 11079 1016 15302 38.513 $1929 1.398 11,057 895 15,279 39,064 at...
Given the Balance Sheet and Income Statement calculate the follow ratios (must include calculations): profit ratio,...
 Given the Balance Sheet and Income Statement calculate the
follow ratios (must include calculations):
profit ratio, liquidity ratio, activity ratio, leverage ratio,
shareholder return ratio
Balance Sheet All numbers in thousands A Get access to 15+ years of historical data with Yahoo Financ Breakdown 12/31/2019 v Assets v Current Assets v Cash Cash And Cash Equivalents 2,594,000 Short Term Investments Total Cash 2,594,000 Net Receivables 25,429,000 Inventory 1,422,000 Other Current Assets Total Current Assets 37,473,000 Total Current Assets 37,473,000 Non-current...
Given the Balance Sheet and Income Statement calculate the
follow ratios (must include calculations):
profit ratio, liquidity ratio, activity ratio, leverage ratio,
shareholder return ratio
Balance Sheet All numbers in thousands A Get access to 15+ years of historical data with Yahoo Financ Breakdown 12/31/2019 v Assets v Current Assets v Cash Cash And Cash Equivalents 2,594,000 Short Term Investments Total Cash 2,594,000 Net Receivables 25,429,000 Inventory 1,422,000 Other Current Assets Total Current Assets 37,473,000 Total Current Assets 37,473,000 Non-current...
Forecast Income Statement and Balance Sheet Following are the income statement and balance sheet for Medtronic...
 Forecast Income Statement and Balance Sheet Following are the income statement and balance sheet for Medtronic PLC. April 26, 2019 $30,557 9,155 2,330 10,418 1,764 Consolidated Statement of Income, 12 Months Ended ($ millions) Net Sales Costs and expenses Cost of products sold Research and development expense Selling, general, and administrative expense Amortization of intangible assets Restructuring charges, net Certain litigation charges Other operating expense, net Operating profit Other nonoperating income, net Interest expense Income before income taxes Income tax...
Based on the income statement and balance sheet. Can you tell me the problem JetBlue is...
 Based on the income statement and balance sheet. Can you tell me
the problem JetBlue is facing?
EXHIBIT 4 Income Statement of JetBlue Fiscal year is January-December. All values USD millions. 2016 2015 2013 2012 4,982 Sales/Revenue 6,632 6,416 5,441 2014 5,817 6.91% 5,048 Sales Growth 3.37% 10.30% 4,831 9.21% 4,789 Cost of Goods Sold (COGS) incl. D&A 5,070 4,412 COGS excluding D&A 4,499 4,677 393 337 4,154 258 Depreciation & Amortization Expense 290 4,486 345 288 57 4,728 320...
Based on the income statement and balance sheet. Can you tell me
the problem JetBlue is facing?
EXHIBIT 4 Income Statement of JetBlue Fiscal year is January-December. All values USD millions. 2016 2015 2013 2012 4,982 Sales/Revenue 6,632 6,416 5,441 2014 5,817 6.91% 5,048 Sales Growth 3.37% 10.30% 4,831 9.21% 4,789 Cost of Goods Sold (COGS) incl. D&A 5,070 4,412 COGS excluding D&A 4,499 4,677 393 337 4,154 258 Depreciation & Amortization Expense 290 4,486 345 288 57 4,728 320...
Analyze, Forecast, and Interpret Income Statement and Balance Sheet
Following are the income statement and balance sheet of DP Inc.DATA PROCESSING INC.Statement of Consolidated EarningsFor Year Ended June 30, 2019, $ millionsTotal revenues$14,175.2Operating expenses7,145.9Systems development and programming costs636.3Depreciation and amortization304.4Total cost of revenues8,086.6Selling, general, and administrative expenses3,064.2Interest expense129.9Total expenses11,280.7Other (income) expense, net(111.1)Earnings before income taxes3,005.6Provision for income taxes712.8Net earnings$2,292.8DATA PROCESSING INC.Balance Sheet$ millionsJune 30,2020ForecastCurrent assetsCash and cash equivalents$1,949.2Accounts receivable, net2,439.3Other current assets519.6Total current assets before funds held for clients4,908.1Funds half for clients29,434.2Total current assets34,342.3Long-term receivables, net23.8Property, plant and equipment,...
Prepare a vertical analysis of the income statement and balance sheet. Show each item on the...
 Prepare a vertical analysis of the income statement and balance
sheet. Show each item on the income statement as a percentage of
the net sales for each year. On the balance sheet, show each asset
item as a percentage of the total assets and each liability and
equity item as a percentage of the total liabilities and
stockholders' equity. Round percentages to one decimal place.
Miller Electronics Corporation Comparative Income Statement For Years Ended December 31, 20-2 and 20-1 20-2...
Prepare a vertical analysis of the income statement and balance
sheet. Show each item on the income statement as a percentage of
the net sales for each year. On the balance sheet, show each asset
item as a percentage of the total assets and each liability and
equity item as a percentage of the total liabilities and
stockholders' equity. Round percentages to one decimal place.
Miller Electronics Corporation Comparative Income Statement For Years Ended December 31, 20-2 and 20-1 20-2...
 Would you recommend an investment in this Jet Blue company? (YES or
NO)
JetBlue Airways Corporation Consolidated Balance Sheets ASSETS CURRENT ASSETs Cash and cash Investment socuritios 538 Recevablos loss allowanoe (2017-$1:2016-s5) 245 47 Inventories, less allowance (2017-$14; 2016-$12) Prepaid exponses and othor 1403 7,868 8.091 Total current assets PROPERTY AND EQUIPMENT 8.980 Flight equipmont 204 .184 Total hight equipment and predolivory dleponits, grons Less accumulated depreciation Total flight equipment and predelivery deposits, net Other property and equipment Less accumulated...
Would you recommend an investment in this Jet Blue company? (YES or
NO)
JetBlue Airways Corporation Consolidated Balance Sheets ASSETS CURRENT ASSETs Cash and cash Investment socuritios 538 Recevablos loss allowanoe (2017-$1:2016-s5) 245 47 Inventories, less allowance (2017-$14; 2016-$12) Prepaid exponses and othor 1403 7,868 8.091 Total current assets PROPERTY AND EQUIPMENT 8.980 Flight equipmont 204 .184 Total hight equipment and predolivory dleponits, grons Less accumulated depreciation Total flight equipment and predelivery deposits, net Other property and equipment Less accumulated...
 Complete a vertical and horizontal analysis on both
the income statement and balance sheet. use total assets on the
balance sheet and net sales on the income statement for your
vertical analysis.
Styles Consolidated Statements of 12 Months Ended Earnings (USD $) In Millions, except Per Share data, unless otherwise specified Income Statement (Abstract] NET SALES Cost of Sales Vertical Vertical Horizontal Feb. 01, 2015 Feb. 02, 2014 Analysis Analysis Analysis $83,176 54,222 $78,812 51,422 GROSS PROFIT Operating Expenses: Selling,...
Complete a vertical and horizontal analysis on both
the income statement and balance sheet. use total assets on the
balance sheet and net sales on the income statement for your
vertical analysis.
Styles Consolidated Statements of 12 Months Ended Earnings (USD $) In Millions, except Per Share data, unless otherwise specified Income Statement (Abstract] NET SALES Cost of Sales Vertical Vertical Horizontal Feb. 01, 2015 Feb. 02, 2014 Analysis Analysis Analysis $83,176 54,222 $78,812 51,422 GROSS PROFIT Operating Expenses: Selling,...
 Problem 23.1A Horizontal and vertical analysis of income
statement and balance sheet. LO 23-1, 23-2
The EastTN Company sells computer parts through a retail store
that it operates. The firm’s comparative income statement and
balance sheet for the years 2016 and 2015 are shown below.
1-a.
Complete both a horizontal and a vertical analysis of
comparative income statement for the years 2016 and 2015.
(Round your percentage answers to 1 decimal place. i.e.,
0.123 should be entered as 12.3.)
1-b....
Problem 23.1A Horizontal and vertical analysis of income
statement and balance sheet. LO 23-1, 23-2
The EastTN Company sells computer parts through a retail store
that it operates. The firm’s comparative income statement and
balance sheet for the years 2016 and 2015 are shown below.
1-a.
Complete both a horizontal and a vertical analysis of
comparative income statement for the years 2016 and 2015.
(Round your percentage answers to 1 decimal place. i.e.,
0.123 should be entered as 12.3.)
1-b....
 BALANCE SHEET
INCOME STATEMENT
** HW DUE *** Need to find these ratios below. Need one for nike
and for adidas for 2018 then one for 2019. EVEN if your only able
to do a couple it will be greatly appreciated!
ADIDAS NIKE Breakdown 5/31/2019 5/31/2018 Breakdown 12/31/2018 12/31/2017 v Assets v Assets Current Assets Current Assets Cash vCash Cash And Cash Equivalents 4,466,000 4249,000 Cash And Cash Equivalents 2.629,000 1,598,000 Short Term Investments 197,000 996,000 Short Term Investments 274,000...
BALANCE SHEET
INCOME STATEMENT
** HW DUE *** Need to find these ratios below. Need one for nike
and for adidas for 2018 then one for 2019. EVEN if your only able
to do a couple it will be greatly appreciated!
ADIDAS NIKE Breakdown 5/31/2019 5/31/2018 Breakdown 12/31/2018 12/31/2017 v Assets v Assets Current Assets Current Assets Cash vCash Cash And Cash Equivalents 4,466,000 4249,000 Cash And Cash Equivalents 2.629,000 1,598,000 Short Term Investments 197,000 996,000 Short Term Investments 274,000...
 Complete a vertical and horizontal analysis on the tabs labeled
"Balance Sheet" and "Income Statement," use total assets on the
balance sheet and net sales on the income statement for your
vertical analysis.
Consolidated Balance Sheets (USD $) In Millions, unless o Feb. 01,2015 Vertical AnalysisFeb. 01,2014Vertical AnalysisHorizontal Analysis therwises fied Current Assets: Cash and Cash Equivalents Receivables, net Merchandise Inventories Other Current Assets Total Current Assets $1.723 1484 11079 1016 15302 38.513 $1929 1.398 11,057 895 15,279 39,064 at...
Complete a vertical and horizontal analysis on the tabs labeled
"Balance Sheet" and "Income Statement," use total assets on the
balance sheet and net sales on the income statement for your
vertical analysis.
Consolidated Balance Sheets (USD $) In Millions, unless o Feb. 01,2015 Vertical AnalysisFeb. 01,2014Vertical AnalysisHorizontal Analysis therwises fied Current Assets: Cash and Cash Equivalents Receivables, net Merchandise Inventories Other Current Assets Total Current Assets $1.723 1484 11079 1016 15302 38.513 $1929 1.398 11,057 895 15,279 39,064 at...
 Given the Balance Sheet and Income Statement calculate the
follow ratios (must include calculations):
profit ratio, liquidity ratio, activity ratio, leverage ratio,
shareholder return ratio
Balance Sheet All numbers in thousands A Get access to 15+ years of historical data with Yahoo Financ Breakdown 12/31/2019 v Assets v Current Assets v Cash Cash And Cash Equivalents 2,594,000 Short Term Investments Total Cash 2,594,000 Net Receivables 25,429,000 Inventory 1,422,000 Other Current Assets Total Current Assets 37,473,000 Total Current Assets 37,473,000 Non-current...
Given the Balance Sheet and Income Statement calculate the
follow ratios (must include calculations):
profit ratio, liquidity ratio, activity ratio, leverage ratio,
shareholder return ratio
Balance Sheet All numbers in thousands A Get access to 15+ years of historical data with Yahoo Financ Breakdown 12/31/2019 v Assets v Current Assets v Cash Cash And Cash Equivalents 2,594,000 Short Term Investments Total Cash 2,594,000 Net Receivables 25,429,000 Inventory 1,422,000 Other Current Assets Total Current Assets 37,473,000 Total Current Assets 37,473,000 Non-current...
 Forecast Income Statement and Balance Sheet Following are the income statement and balance sheet for Medtronic PLC. April 26, 2019 $30,557 9,155 2,330 10,418 1,764 Consolidated Statement of Income, 12 Months Ended ($ millions) Net Sales Costs and expenses Cost of products sold Research and development expense Selling, general, and administrative expense Amortization of intangible assets Restructuring charges, net Certain litigation charges Other operating expense, net Operating profit Other nonoperating income, net Interest expense Income before income taxes Income tax...
 Based on the income statement and balance sheet. Can you tell me
the problem JetBlue is facing?
EXHIBIT 4 Income Statement of JetBlue Fiscal year is January-December. All values USD millions. 2016 2015 2013 2012 4,982 Sales/Revenue 6,632 6,416 5,441 2014 5,817 6.91% 5,048 Sales Growth 3.37% 10.30% 4,831 9.21% 4,789 Cost of Goods Sold (COGS) incl. D&A 5,070 4,412 COGS excluding D&A 4,499 4,677 393 337 4,154 258 Depreciation & Amortization Expense 290 4,486 345 288 57 4,728 320...
Based on the income statement and balance sheet. Can you tell me
the problem JetBlue is facing?
EXHIBIT 4 Income Statement of JetBlue Fiscal year is January-December. All values USD millions. 2016 2015 2013 2012 4,982 Sales/Revenue 6,632 6,416 5,441 2014 5,817 6.91% 5,048 Sales Growth 3.37% 10.30% 4,831 9.21% 4,789 Cost of Goods Sold (COGS) incl. D&A 5,070 4,412 COGS excluding D&A 4,499 4,677 393 337 4,154 258 Depreciation & Amortization Expense 290 4,486 345 288 57 4,728 320...
 Prepare a vertical analysis of the income statement and balance
sheet. Show each item on the income statement as a percentage of
the net sales for each year. On the balance sheet, show each asset
item as a percentage of the total assets and each liability and
equity item as a percentage of the total liabilities and
stockholders' equity. Round percentages to one decimal place.
Miller Electronics Corporation Comparative Income Statement For Years Ended December 31, 20-2 and 20-1 20-2...
Prepare a vertical analysis of the income statement and balance
sheet. Show each item on the income statement as a percentage of
the net sales for each year. On the balance sheet, show each asset
item as a percentage of the total assets and each liability and
equity item as a percentage of the total liabilities and
stockholders' equity. Round percentages to one decimal place.
Miller Electronics Corporation Comparative Income Statement For Years Ended December 31, 20-2 and 20-1 20-2...
Most questions answered within 3 hours.
-
1. Nimbus, Inc. produces and sells brooms. This table shows the
relationship between the number of...
asked 1 minute ago -
A gas occupies 200. mL in a piston. If the pressure of the
piston were decreased...
asked 17 minutes ago -
A fossil is found to have a 14C level of 71.0% compared to
living organisms. How...
asked 21 minutes ago -
Many communist or socialist countries have a department that
addresses public health as well as the...
asked 23 minutes ago -
the following questions are either true or false answers
1. The Central Limit Theorem allows one...
asked 23 minutes ago -
The patient recovery time from a particular surgical procedure
is normally distributed with a mean of...
asked 29 minutes ago -
Human relations refer to the way a company arranges people,
jobs, and communications so that work...
asked 46 minutes ago -
Python Program: Design the logic for and implement a program
that merges the two files into...
asked 45 minutes ago -
The specific radiocarbon activity of a sample of wood is 6.25
gms dpm/gm of carbon. The...
asked 50 minutes ago -
An aqueous magnesium chloride solution is made by dissolving
6.96 moles of MgCl2 in sufficient water...
asked 52 minutes ago -
Ken believes the average age of men who come to get a haircut at
his barber...
asked 1 hour ago -
(Ratio Analysis): Last year Co. XYZ had sales of $ 400,000, with
“cost of goods sold”...
asked 1 hour ago