1st regression analysis

2nd regression analysis

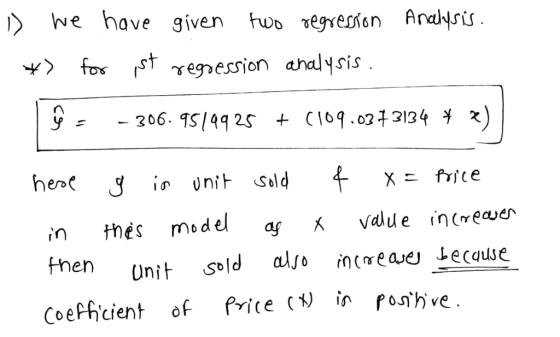
1. Analyze the two regression analysis's above and make a recommendation on if the organization should increase, decrease, or retain their pricing and why?
2. What happens to the dependent variable Y if the price X1 decreases in the second regression analysis?
Homework Answers


Add Answer to:
1st regression analysis 2nd regression analysis 1. Analyze the two regression analysis's above ...
Regression Statistics Multiple R 0.88012 R Square 0.77461 Adjusted R Square 0.77190 Standard Error 56.6927 Observations...
 Regression Statistics Multiple R 0.88012 R Square 0.77461 Adjusted R Square 0.77190 Standard Error 56.6927 Observations 253 ANOVA Significance 285.2516 MS 916816.787 3214.0637 Regression Residual Total 0.000 2750450.3598 800301.8665 3550752.226 252 Intercept Income Coefficients Standard Error 70.2382 15.8338 5.45850 .2485 t Stat P-value 4.4360 0.000014 21.96960 .000 Lower 3 9.053 4.969 "pper 95% 1.4234 479 HULLU LIIS TILIR. SUMMARY OUTPUT Regression Statistics Multiple R 0.8778 R Square Adjusted R Square 0.6558 Standard Error Observations ANOVA ANOVA Significance Regression 45.3528 de...
7,10,11 Based on the following regression output, what is the equation of the regression line? Regression...
 7,10,11
Based on the following regression output, what is the equation of the regression line? Regression Statistics Multiple R 0.917214 R Square 0.841282 Adjusted R Square 0.821442 Standard Error 9.385572 Observations 10 ANOVA df SS MS Significance F 1 Regression 3735.3060 3735.30600 42.40379 0.000186 8 Residual 704.7117 88.08896 9 Total 4440.0170 Coefficients Standard Error t Stat P-value Lower 95% Intercept 31.623780 10.442970 3.028236 0.016353 7.542233 X Variable 1.131661 0.173786 6.511819 0.000186 0.730910 o a. 9; = 7.542233+0.7309 Xli o b....
7,10,11
Based on the following regression output, what is the equation of the regression line? Regression Statistics Multiple R 0.917214 R Square 0.841282 Adjusted R Square 0.821442 Standard Error 9.385572 Observations 10 ANOVA df SS MS Significance F 1 Regression 3735.3060 3735.30600 42.40379 0.000186 8 Residual 704.7117 88.08896 9 Total 4440.0170 Coefficients Standard Error t Stat P-value Lower 95% Intercept 31.623780 10.442970 3.028236 0.016353 7.542233 X Variable 1.131661 0.173786 6.511819 0.000186 0.730910 o a. 9; = 7.542233+0.7309 Xli o b....
HW # 5 Linear Regression: Use Data Analysis in Excel to conduct the Regression Analysis to...
HW # 5 Linear Regression: Use Data Analysis in Excel to conduct the Regression Analysis to reproduce the excel out put below (Note: First enter the data in the next page in an Excel spreadsheet) Home Sale Price: The table below provides the Excel output of a regression analysis of the relationship between Home sale price(Y) measured in thousand dollars and Square feet area (x): SUMMARY OUTPUT Dependent: Home Price ($1000) Regression Statistics Multiple R 0.691 R Square 0.478 Adjusted...
Calculate the following statistics given the existing information (1 point per calculation): Regression Statistics Multiple R...
Calculate the following statistics given the existing information (1 point per calculation): Regression Statistics Multiple R R Square Adjusted R Square 0.559058 Standard Error Observations 30 ANOVA df SS MS F Significance F Regression 2 3609132796 19.38411515 6.02827E-06 Residual 27 2513568062 Total 29 6122700857 Coefficients Standard Error t Stat P-value Lower 95% Upper 95% Intercept -15800.8 57294.51554 -0.27578 0.784814722 CARAT 12266.83 1999.250369 6.135715 1.48071E-06 DEPTH 156.686 928.9461882 0.168671 0.867312915 Additionally interpret your results. Be sure to comment on Accuracy, significance...
What is the coefficient? What is the standard error? What is the z-statistic? Is the coefficient...
 What is the coefficient?
What is the standard error?
What is the z-statistic?
Is the coefficient sufficiently different from zero? How about
one? Explain.
SUMMARY OUTPUT Regression Statistics Multiple R 0.58175248 R Square 0.33843594 Adjusted R S 0.31393357 Standard Err 1.1991813 Observations 29 ANOVA df SS MS Significance F 0.000932269 Regression 1 19.86268888 19.86268888 13.8123745 Residual 38.82696629 27 1.438035789 Total 58.68965517 28 Coefficients Standard Error P-value t Stat Lower 95% Upper 95% Lower 95.0% Upper 95.0% Intercept -0.0202247 0.223805467 -0.090367404...
What is the coefficient?
What is the standard error?
What is the z-statistic?
Is the coefficient sufficiently different from zero? How about
one? Explain.
SUMMARY OUTPUT Regression Statistics Multiple R 0.58175248 R Square 0.33843594 Adjusted R S 0.31393357 Standard Err 1.1991813 Observations 29 ANOVA df SS MS Significance F 0.000932269 Regression 1 19.86268888 19.86268888 13.8123745 Residual 38.82696629 27 1.438035789 Total 58.68965517 28 Coefficients Standard Error P-value t Stat Lower 95% Upper 95% Lower 95.0% Upper 95.0% Intercept -0.0202247 0.223805467 -0.090367404...
Dep.= % WRK Indep.= % MGT SUMMARY OUTPUT Regression Statistics Multiple R R Square Adjusted R...
Dep.= % WRK Indep.= % MGT SUMMARY OUTPUT Regression Statistics Multiple R R Square Adjusted R Square Standard Error Observations ANOVA Significance df SS MS F F Regression 102.1488 148.9539 Residual Total 12.0000 Standard Coefficients Error t Stat P-value Lower 95% Upper 95% Intercept % MGT 0.4543 SE CI CI PI PI Predicted Predicted Lower Upper Lower Upper x0 Value Value 95% 95% 95% 95% 67.0000 67.8474 65.8779 69.8169 72.0000 70.1189 68.2003 72.0375 76.0000 71.9361 69.7884 74.0838 Dep.= % MGT...
You were asked by your manager to evaluate the regression tables below to decide which cost driver would be best to use...
You were asked by your manager to evaluate the regression tables below to decide which cost driver would be best to use for the production department. Since your manager is new and does not understand the regression analysis tables, you will need to explain why one set of statistics is better than the other and why you have chosen the better driver. Manufacturing Direct Labor Hours Regression Statistics Multiple R 0.799304258 R Square 0.638887297 Adjusted R Square 0.602776026 Standard Error...
We are doing regression analysis for business analytics class and I am having a hard time reading...
We are doing regression analysis for business analytics class and I am having a hard time reading this data. Please help. SUMMARY OUTPUT Regression Statistics Multiple R 0.999964 R Square 0.999928 Adjusted R Square 0.9999248 Standard Error 267.074107 Observations 48 ANOVA df SS MS F Significance F Regression 2 44576676715 2.23E+10 312474.2 6.1672E-94 Residual 45 3209786.045 71328.58 Total 47 44579886501 Coefficients Standard Error t Stat P-value Lower 95% Upper 95% Lower 95.0% Upper 95.0% Intercept -42159057 121894.4727 -345.865 1.04E-78 -42404564.6...
5. Summary of regression between a dependent variable y and two independent variables X, and x2...
 5. Summary of regression between a dependent variable y and two independent variables X, and x2 is as follows. Please complete the table: SUMMARY OUTPUT Regression Statistics Multiple R 0.9620 R Square R2E? Adjusted R Square 0.9043 Standard Error 12.7096 Observations 10 ANOVA F Significance F F=? Overall p-value=? Regression Residual Total 2 df of SSE MS MSR=? MSE? 14052.1550 1130.7450 SSTE? MSE? 9 Coefficients -18.3683 Standard Error 17.9715 t Stat -1.0221 Intercept ty=? 2.0102 4.7378 0.2471 0.9484 P-value 0.3408...
Hi I was wondering if i could have some help with some distribution questions. 1. show...
 Hi I was wondering if i could have some help with some
distribution questions.
1. show where zero and one fall on a normal distribution based on
thedata.
2.is the coefficient sufficiently different than zero?
explain
3. is the coefficient sufficiently different than one? explain.
Regression Statistics Multiple R 0.806174983 0.649918103 R Square Adjusted R Square Standard Error Observations 0.636952107 13.57635621 29 ANOVA Significance F E SS MS df 9238.877183 9238.877 50.12481 1.30123E-07 Regression Residual 4976.571093 184.3174 27 14215.44828 Total...
Hi I was wondering if i could have some help with some
distribution questions.
1. show where zero and one fall on a normal distribution based on
thedata.
2.is the coefficient sufficiently different than zero?
explain
3. is the coefficient sufficiently different than one? explain.
Regression Statistics Multiple R 0.806174983 0.649918103 R Square Adjusted R Square Standard Error Observations 0.636952107 13.57635621 29 ANOVA Significance F E SS MS df 9238.877183 9238.877 50.12481 1.30123E-07 Regression Residual 4976.571093 184.3174 27 14215.44828 Total...
 Regression Statistics Multiple R 0.88012 R Square 0.77461 Adjusted R Square 0.77190 Standard Error 56.6927 Observations 253 ANOVA Significance 285.2516 MS 916816.787 3214.0637 Regression Residual Total 0.000 2750450.3598 800301.8665 3550752.226 252 Intercept Income Coefficients Standard Error 70.2382 15.8338 5.45850 .2485 t Stat P-value 4.4360 0.000014 21.96960 .000 Lower 3 9.053 4.969 "pper 95% 1.4234 479 HULLU LIIS TILIR. SUMMARY OUTPUT Regression Statistics Multiple R 0.8778 R Square Adjusted R Square 0.6558 Standard Error Observations ANOVA ANOVA Significance Regression 45.3528 de...
 7,10,11
Based on the following regression output, what is the equation of the regression line? Regression Statistics Multiple R 0.917214 R Square 0.841282 Adjusted R Square 0.821442 Standard Error 9.385572 Observations 10 ANOVA df SS MS Significance F 1 Regression 3735.3060 3735.30600 42.40379 0.000186 8 Residual 704.7117 88.08896 9 Total 4440.0170 Coefficients Standard Error t Stat P-value Lower 95% Intercept 31.623780 10.442970 3.028236 0.016353 7.542233 X Variable 1.131661 0.173786 6.511819 0.000186 0.730910 o a. 9; = 7.542233+0.7309 Xli o b....
7,10,11
Based on the following regression output, what is the equation of the regression line? Regression Statistics Multiple R 0.917214 R Square 0.841282 Adjusted R Square 0.821442 Standard Error 9.385572 Observations 10 ANOVA df SS MS Significance F 1 Regression 3735.3060 3735.30600 42.40379 0.000186 8 Residual 704.7117 88.08896 9 Total 4440.0170 Coefficients Standard Error t Stat P-value Lower 95% Intercept 31.623780 10.442970 3.028236 0.016353 7.542233 X Variable 1.131661 0.173786 6.511819 0.000186 0.730910 o a. 9; = 7.542233+0.7309 Xli o b....
 What is the coefficient?
What is the standard error?
What is the z-statistic?
Is the coefficient sufficiently different from zero? How about
one? Explain.
SUMMARY OUTPUT Regression Statistics Multiple R 0.58175248 R Square 0.33843594 Adjusted R S 0.31393357 Standard Err 1.1991813 Observations 29 ANOVA df SS MS Significance F 0.000932269 Regression 1 19.86268888 19.86268888 13.8123745 Residual 38.82696629 27 1.438035789 Total 58.68965517 28 Coefficients Standard Error P-value t Stat Lower 95% Upper 95% Lower 95.0% Upper 95.0% Intercept -0.0202247 0.223805467 -0.090367404...
What is the coefficient?
What is the standard error?
What is the z-statistic?
Is the coefficient sufficiently different from zero? How about
one? Explain.
SUMMARY OUTPUT Regression Statistics Multiple R 0.58175248 R Square 0.33843594 Adjusted R S 0.31393357 Standard Err 1.1991813 Observations 29 ANOVA df SS MS Significance F 0.000932269 Regression 1 19.86268888 19.86268888 13.8123745 Residual 38.82696629 27 1.438035789 Total 58.68965517 28 Coefficients Standard Error P-value t Stat Lower 95% Upper 95% Lower 95.0% Upper 95.0% Intercept -0.0202247 0.223805467 -0.090367404...
 5. Summary of regression between a dependent variable y and two independent variables X, and x2 is as follows. Please complete the table: SUMMARY OUTPUT Regression Statistics Multiple R 0.9620 R Square R2E? Adjusted R Square 0.9043 Standard Error 12.7096 Observations 10 ANOVA F Significance F F=? Overall p-value=? Regression Residual Total 2 df of SSE MS MSR=? MSE? 14052.1550 1130.7450 SSTE? MSE? 9 Coefficients -18.3683 Standard Error 17.9715 t Stat -1.0221 Intercept ty=? 2.0102 4.7378 0.2471 0.9484 P-value 0.3408...
 Hi I was wondering if i could have some help with some
distribution questions.
1. show where zero and one fall on a normal distribution based on
thedata.
2.is the coefficient sufficiently different than zero?
explain
3. is the coefficient sufficiently different than one? explain.
Regression Statistics Multiple R 0.806174983 0.649918103 R Square Adjusted R Square Standard Error Observations 0.636952107 13.57635621 29 ANOVA Significance F E SS MS df 9238.877183 9238.877 50.12481 1.30123E-07 Regression Residual 4976.571093 184.3174 27 14215.44828 Total...
Hi I was wondering if i could have some help with some
distribution questions.
1. show where zero and one fall on a normal distribution based on
thedata.
2.is the coefficient sufficiently different than zero?
explain
3. is the coefficient sufficiently different than one? explain.
Regression Statistics Multiple R 0.806174983 0.649918103 R Square Adjusted R Square Standard Error Observations 0.636952107 13.57635621 29 ANOVA Significance F E SS MS df 9238.877183 9238.877 50.12481 1.30123E-07 Regression Residual 4976.571093 184.3174 27 14215.44828 Total...
Most questions answered within 3 hours.
-
1. Write
the chemical equation for the synthesis of aspirin (ASA) from
salicylic acid (SA) and acetic...
asked 15 minutes ago -
True or False? If ammonia synthesis occurs at 723 K and 100 atm,
its equilibrium constant...
asked 13 minutes ago -
The reaction of iron and water vapor results in an equilibrium 3
Fe(s) + 4 H2O...
asked 14 minutes ago -
Bill Alther is a zoologist who studies Anna's hummingbird
(Calypte anna).† Suppose that in a remote...
asked 16 minutes ago -
It is important that face masks used by firefighters be able to
withstand high temperatures because...
asked 36 minutes ago -
explain with the experiment showing one gene one
enzyme hypothesis by tantum and beadle?
asked 34 minutes ago -
test the null hypothesis H0
H0 : In college, the average GPA of men is equal...
asked 1 hour ago -
Question: Finish task 11) using sed with
back-reference.
11) Use sed to list only the company...
asked 59 minutes ago -
Do a little research on Amazon and share with everyone your view
of its business model...
asked 57 minutes ago -
Discuss the pros and cons to using social media for marketing in
the dealership organizational model...
asked 51 minutes ago -
What is the mole fraction of MgCl2 (95.12 g/mol) in an
aqueous solution that is 5.80...
asked 53 minutes ago -
Based on the brainstorming you have
been doing, share what you’ve come up with and then...
asked 57 minutes ago