
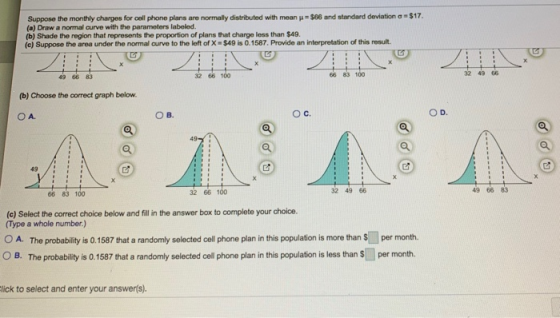
Suppose the monthly charges for oil phone plans are normally distributed with mean μ-S00 and standard deviation σ-S17 (a) Draw a normal curve with the paramoters labeled (b) Shade the region that represents the proportion of plans that charge less than $49. (c) Suppose the area under the normal curve to the left of X $49 is 0.1587. Provide an interpretation of this resuilt 32 66 100 66 83 100 32 49 66 49 66 83 (b) Choose the correct graph below O A. O B Ос. O D. 49 32 66 100 32 49 66 49 66 83 66 83 100 (e) Select the correct choice below and fill in the answer box to complete your choice. (Type a whole number.) O A. The probability is 0.1587 that a randomly selected cell phone plan in this population is more than S per month. O B. The probability is 0.1587 that a randomly selected cell phone plan in this population is less than $ per month. lick to select and enter your answer(s).
Homework Answers
a)

b)

c) B. The probability is 0.1587 that a randomly selected cell phone plan in this population is less than $49 per month
Add Answer to:
Suppose the monthly charges for ool phone plans are normaly distributed with mean μ-$66 and stand...
Suppose the monthly charges for cell phone plans are normally distributed with mean u = $61...
 Suppose the monthly charges for cell phone plans are normally distributed with mean u = $61 and standard deviation = $17. (a) Draw a normal curve with the parameters labeled (b) Shade the region that represents the proportion of plans that charge less than $44 (c) Suppose the area under the normal curve to the left of X = $44 is 0.1587. Provide an interpretation of this result (a) Choose the correct graph below. ОА. OB. 276195 Click to select...
This Question: 6 pts 13 of 15 (8 complete This Quiz: E QUE $17. Suppose the...
 This Question: 6 pts 13 of 15 (8 complete This Quiz: E QUE $17. Suppose the monthly charges for cell phone plans are normally distributed with mean 3 68 and standard deviation (a) Draw a normal curve with the parameters labeled b) Shade the region that represents the proportion of plans that charge less than $51. le) Suppose the area under the normal curve to the left of X = $51 is 0.1587. Provide an interpretation of this result (b)...
Applying the Concepts NW 31. You Explain It! Cell Phone Rates Monthly charges for cell phone...
 Applying the Concepts NW 31. You Explain It! Cell Phone Rates Monthly charges for cell phone plans in the United States are normally distributed with mean μ $62 and standard deviation σ $18. Source: Based on information from Consumer Reports (a) Draw a normal curve with the parameters la (b) Shade the region that represents the proportion of plans beled. charge less than $44 (c) Suppose the area under the normal curve to the left of x = $44 is...
10 of 32 16 complete Suppose the birth weights of full-term babies are normally distributed with...
 10 of 32 16 complete Suppose the birth weights of full-term babies are normally distributed with mean 3750 grams and standard deviation - 475 grams Complete parts (a) through (c) below (a) Draw a normal curve with the parameters labeled. Choose the correct graph below ОА. OB OC OD no a 3150 4335 4700 3975 800 2000 4730 (b) Shade the region that represents the proportion of full-term babies who weigh more than 4700 grams Choose the correct graph below...
Suppose the birth weights of full-term babies are normally distributed with mean 3600 grams and standard...
 Suppose the birth weights of full-term babies are normally
distributed with mean 3600 grams and standard deviation σ = 480
grams. Complete parts (a) through (c) below.
Suppose the birth weights of full-term babies are normally distributed with mean 3600 grams and standard de ation σ=480 grams. Complete parts a through c) below. (a) Draw a normal curve with the parameters labeled. Choose the corect graph below O A. C. Ο D. 3120/4080 28404560 264013600 3600 3600 3120 (b) Shade...
Suppose the birth weights of full-term babies are normally
distributed with mean 3600 grams and standard deviation σ = 480
grams. Complete parts (a) through (c) below.
Suppose the birth weights of full-term babies are normally distributed with mean 3600 grams and standard de ation σ=480 grams. Complete parts a through c) below. (a) Draw a normal curve with the parameters labeled. Choose the corect graph below O A. C. Ο D. 3120/4080 28404560 264013600 3600 3600 3120 (b) Shade...
i need help now please i dont get it. !!! Question Help o Steel rods are...
 i need help now please i dont get it.
!!! Question Help o Steel rods are manufactured with a mean length of 25 centimeter (cm). Because of variability in the manufacturing process, the lengths of the rods are approximately normally distributed with a standard deviation of 0.07 cm. Complete parts (a) to (d) (a) What proportion of rods has a length less than 24.9 cm? (Round to four decimal places as needed.) (b) Any rods that are shorter than 24...
i need help now please i dont get it.
!!! Question Help o Steel rods are manufactured with a mean length of 25 centimeter (cm). Because of variability in the manufacturing process, the lengths of the rods are approximately normally distributed with a standard deviation of 0.07 cm. Complete parts (a) to (d) (a) What proportion of rods has a length less than 24.9 cm? (Round to four decimal places as needed.) (b) Any rods that are shorter than 24...
Suppose a random variable is normally distributed with a mean of 400 and a standard deviation...
Suppose a random variable is normally distributed with a mean of 400 and a standard deviation of 100. a)Draw a normal curve with the parameters labeled. b)Shade the region under the normal curve that represents the probability of observing a value of the random variable that is less than 600. c)Suppose the area under the normal curve below 600 is 0.9772. Provide two interpretations of this area.
Suppose the lengths of human pregnancies are normally distributed with 266 days and ơ16 days. Complete...
 Suppose the lengths of human pregnancies are normally distributed with 266 days and ơ16 days. Complete parts a and b below. The f ure to he ri ht represents the normal curve with μ-2 6 days and : 16 days. The area to the right O X-290 is 0.0668, provide two interpretations of this area. a Provide one interpretation of the area. Select the correct choice below and fill in the answer boxes to complete your choice. Type integers or...
Suppose the lengths of human pregnancies are normally distributed with 266 days and a = 16...
 Suppose the lengths of human pregnancies are normally distributed with 266 days and a = 16 days. Complete parts (a) and (b) below. a) The figure to the right represents the normal curve with 266 days and = 16 days. The area to the left of X = 230 is 0.0122. Provide two interpretations of this area Provide one interpretation of the area using the given values. Select the correct choice below and fill in the answer boxes to complete...
(a) The figure to the right represents the normal curve with μ = 266 days and...
 (a) The figure to the right represents the normal curve with μ = 266 days and σ = 16 days. The area to the right of X-290 is 0 0668 Provide two interpretations of this area. Provide one interpretation of the area. Select the correct choice below and fill in the answer boxes to complete your choice. (Type integers or decimals. Do not round.) A. The proportion of human pregnancies that last more than 290 days is 0.0668 The proportion...
 Suppose the monthly charges for cell phone plans are normally distributed with mean u = $61 and standard deviation = $17. (a) Draw a normal curve with the parameters labeled (b) Shade the region that represents the proportion of plans that charge less than $44 (c) Suppose the area under the normal curve to the left of X = $44 is 0.1587. Provide an interpretation of this result (a) Choose the correct graph below. ОА. OB. 276195 Click to select...
 This Question: 6 pts 13 of 15 (8 complete This Quiz: E QUE $17. Suppose the monthly charges for cell phone plans are normally distributed with mean 3 68 and standard deviation (a) Draw a normal curve with the parameters labeled b) Shade the region that represents the proportion of plans that charge less than $51. le) Suppose the area under the normal curve to the left of X = $51 is 0.1587. Provide an interpretation of this result (b)...
 Applying the Concepts NW 31. You Explain It! Cell Phone Rates Monthly charges for cell phone plans in the United States are normally distributed with mean μ $62 and standard deviation σ $18. Source: Based on information from Consumer Reports (a) Draw a normal curve with the parameters la (b) Shade the region that represents the proportion of plans beled. charge less than $44 (c) Suppose the area under the normal curve to the left of x = $44 is...
 10 of 32 16 complete Suppose the birth weights of full-term babies are normally distributed with mean 3750 grams and standard deviation - 475 grams Complete parts (a) through (c) below (a) Draw a normal curve with the parameters labeled. Choose the correct graph below ОА. OB OC OD no a 3150 4335 4700 3975 800 2000 4730 (b) Shade the region that represents the proportion of full-term babies who weigh more than 4700 grams Choose the correct graph below...
 Suppose the birth weights of full-term babies are normally
distributed with mean 3600 grams and standard deviation σ = 480
grams. Complete parts (a) through (c) below.
Suppose the birth weights of full-term babies are normally distributed with mean 3600 grams and standard de ation σ=480 grams. Complete parts a through c) below. (a) Draw a normal curve with the parameters labeled. Choose the corect graph below O A. C. Ο D. 3120/4080 28404560 264013600 3600 3600 3120 (b) Shade...
Suppose the birth weights of full-term babies are normally
distributed with mean 3600 grams and standard deviation σ = 480
grams. Complete parts (a) through (c) below.
Suppose the birth weights of full-term babies are normally distributed with mean 3600 grams and standard de ation σ=480 grams. Complete parts a through c) below. (a) Draw a normal curve with the parameters labeled. Choose the corect graph below O A. C. Ο D. 3120/4080 28404560 264013600 3600 3600 3120 (b) Shade...
 i need help now please i dont get it.
!!! Question Help o Steel rods are manufactured with a mean length of 25 centimeter (cm). Because of variability in the manufacturing process, the lengths of the rods are approximately normally distributed with a standard deviation of 0.07 cm. Complete parts (a) to (d) (a) What proportion of rods has a length less than 24.9 cm? (Round to four decimal places as needed.) (b) Any rods that are shorter than 24...
i need help now please i dont get it.
!!! Question Help o Steel rods are manufactured with a mean length of 25 centimeter (cm). Because of variability in the manufacturing process, the lengths of the rods are approximately normally distributed with a standard deviation of 0.07 cm. Complete parts (a) to (d) (a) What proportion of rods has a length less than 24.9 cm? (Round to four decimal places as needed.) (b) Any rods that are shorter than 24...
 Suppose the lengths of human pregnancies are normally distributed with 266 days and ơ16 days. Complete parts a and b below. The f ure to he ri ht represents the normal curve with μ-2 6 days and : 16 days. The area to the right O X-290 is 0.0668, provide two interpretations of this area. a Provide one interpretation of the area. Select the correct choice below and fill in the answer boxes to complete your choice. Type integers or...
 Suppose the lengths of human pregnancies are normally distributed with 266 days and a = 16 days. Complete parts (a) and (b) below. a) The figure to the right represents the normal curve with 266 days and = 16 days. The area to the left of X = 230 is 0.0122. Provide two interpretations of this area Provide one interpretation of the area using the given values. Select the correct choice below and fill in the answer boxes to complete...
 (a) The figure to the right represents the normal curve with μ = 266 days and σ = 16 days. The area to the right of X-290 is 0 0668 Provide two interpretations of this area. Provide one interpretation of the area. Select the correct choice below and fill in the answer boxes to complete your choice. (Type integers or decimals. Do not round.) A. The proportion of human pregnancies that last more than 290 days is 0.0668 The proportion...
Most questions answered within 3 hours.
-
Please use python to explain.
Assume that the variables x and
y refer to strings. Write...
asked 3 minutes ago -
This table shows the US domestic demand and supply schedules
for oranges. Suppose the world price...
asked 2 minutes ago -
Please help me create a CLASS DIAGRAM for this code:
import pygame
from pygame.sprite import Sprite...
asked 4 minutes ago -
The Merriweather Printing Company is trying to decide on the
merits of constructing a new publishing...
asked 23 minutes ago -
29) Insulin is a water-soluble hormone transported in the blood.
Which describes a likely way in...
asked 30 minutes ago -
Harden, Harden, & Harden is a venerable Wall Street stock
brokerage firm. It has its business...
asked 30 minutes ago -
How do we determine the ultimate radioactive decay product of
the uranium-238 series is lead?
asked 34 minutes ago -
> Women’s pulse rates are normally distributed with a mean of
68.5 beats per minute and...
asked 41 minutes ago -
Briefly describe an aspect of the strengths perspective that is
consistent with your own understanding of...
asked 43 minutes ago -
Step by step method of using Sparse Identification of Nonlinear
Dynamics (SINDy) to model your own...
asked 51 minutes ago -
3) What are the typical social structures in a global city?
asked 3 hours ago -
Luther Corporation
Consolidated Balance Sheet
December 31, 2019 and 2018 (in $ millions)
Assets
2019
2018...
asked 3 hours ago