

a search this course SAGE MINDTAP Using a an esti ated regression equation for the data of the form y bg + bız + bg2 Comment on the adequacy of this equation for predicting y Enter negative value as negative number, if your answer is zero, enter "0' x + x2 (to 2 decimals) R-sq adj- (to 1 decimal) p-value (to 4 decimals) SOURCE DF MS (to 3 decimals) (to 3 decimais) (to 2 decimals) Regression | Residual Error Total % (to 1 decimal) of the variability in y has been explained by z. (to 2 decimals) Check My Work (3 remaining)
Homework Answers
a.
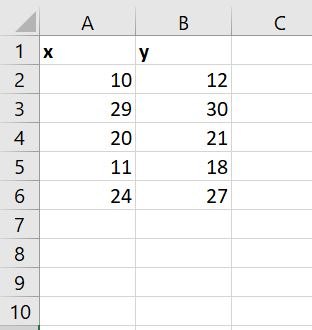
Step 1 - Put the data in excel as shown and arrange the variables as shown
Step 2 - Since we need to predict y
The dependent variable is y
The independent variable is x
Step 3 - Select the regression option from the data analysis tab

Step 4 - Input the values as shown below.

Step 5 - The output is generated as follows.

Regession equation ( highlighted in yellow)
y = 5.9379 + 0.833 x
s = 2.3983 ( highlighted in blue)
rsqure = 0.9159 (highlighted in green)
r sq adjusted = 0.8878
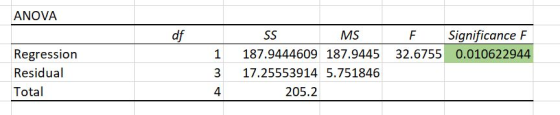
anova
Using the 0.05 significance level, the pvalue indicates a high significance , note the 91 % of the variablity in y has been explained by x.
b.
Step 1 - Put the data in excel as shown, also create x2 and arrange the variables as shown

Step 2 - Since we need to predict y
The dependent variable is y
The independent variable is x, x2
Step 3 - Select the regression option from the data analysis tab

Step 4 - Input the values as shown below.

Step 5 - The output is generated as follows.
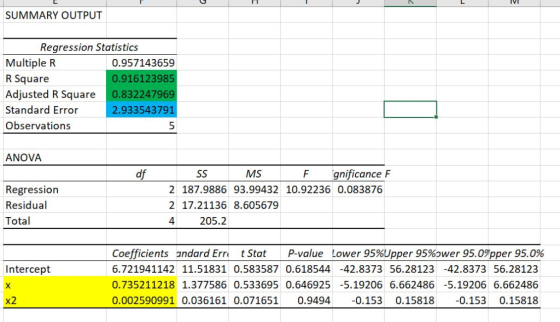
Regession equation ( highlighted in yellow)
y= 6.7219 +0.7352 x +0.0025 x2
s = 2.9335 ( highlighted in blue)
rsqure = 0.9161 (highlighted in green)
r sq adjusted = 0.8322
anova
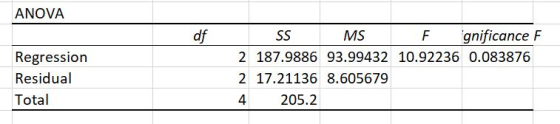
Using the 0.05 significance level, the pvalue indicates a no significance , note the 91 % of the variablity in y has been explained by x.
c.
Since the only the first model is signficant, we will use the first regression equation to predict.
y = 5.9379 + 0.833 x
y = 5.9379 + 0.833 (17) = 20.1004
Add Answer to:
Course NGAGE MINDTAP z and y. z | 10 220 11 24 12 30 21 18 27 equation for the data of the form b...
Given are five observations for two variables, x and y. 4 8 12 16 18 yi...
 Given are five observations for two variables, x and y. 4 8 12 16 18 yi 58 51 48 14 15 The estimated regression equation for these data is y= 76.77 - 3.41x a. Compute SSE, SST, and SSR (to 2 SSE decimals) (to 2 SST decimals) (to 2 SSR decimals) b. Compute the coefficient of determination r. Comment on the goodness of fit (to 3 decimals) % of the variability in y has been explained by the estimated regression...
Consider the following data for two variables, x and y. (a) Develop an estimated regression equation...
 Consider the following data for two variables, x and y. (a) Develop an estimated regression equation for the data of the form ý = bo + 5,x. (Round bo to two decimal places and b, to three decimal places.) Comment on the adequacy of this equation for predicting y. (Use a = 0.05.) The high p-value and low coefficient of determination indicate that the equation is inadequate. The high p-value and high coefficient of determination indicate that the equation is...
Risk Age Blood Pressure Smoker 10 59 220 1 33 67 129 0 14 68 170...
 Risk
Age
Blood Pressure
Smoker
10
59
220
1
33
67
129
0
14
68
170
0
59
63
198
0
30
65
173
0
52
74
172
1
9
77
159
0
28
73
173
0
32
68
117
1
20
80
209
1
40
62
176
1
41
82
110
0
25
67
151
1
56
55
191
0
36
61
208
1
32
61
112
1
26
78
125
0
28
75
129
0
18
90
184...
Risk
Age
Blood Pressure
Smoker
10
59
220
1
33
67
129
0
14
68
170
0
59
63
198
0
30
65
173
0
52
74
172
1
9
77
159
0
28
73
173
0
32
68
117
1
20
80
209
1
40
62
176
1
41
82
110
0
25
67
151
1
56
55
191
0
36
61
208
1
32
61
112
1
26
78
125
0
28
75
129
0
18
90
184...
x1 6 11 15 18 20 y1 6 8 12 20 30 Compute b1 and b0...
x1 6 11 15 18 20 y1 6 8 12 20 30 Compute b1 and b0 (to 3 decimals). Enter negative values as negative numbers. b1 b0 Complete the estimated regression equation (to 3 decimals). Enter negative values as negative numbers. y^ = ____ + _____ x x1 x2 x3 x4 x5 Compute the standardized residuals. Enter negative values as negative numbers. standardized residual 1 (to 4 decimal places) 2 (to 4 decimal places) 3 (to 4 decimal places) 4...
A 10-year study conducted by the American Heart Association provided data on how age, blood pressure,...
A 10-year study conducted by the American Heart Association provided data on how age, blood pressure, and smoking relate to the risk of strokes. Data from a portion of this study follow. Risk is interpreted as the probability (times 100) that a person will have a stroke over the next 10-year period. For the smoker variable, 1 indicates a smoker and 0 indicates a nonsmoker. Risk Age Blood Pressure Smoker 14 58 201 0 23 82 98 1 25 74...
Suppose that we want to find a regression equation relating systolic blood pressure (y) to weight...
Suppose that we want to find a regression equation relating systolic blood pressure (y) to weight (x1), age (x2) and smoking status (0 = does not smoke, 1 = smokes less than one pack per day, 2 = smokes one or more packs per day). Use the Minitab outputs below to test whether or not the smoking status variable adds to the predictive value of a model which already contains weight and age, using α = .05. i.e., test the...
Statistical software was used to fit the model E(y)Pox1 2x2 to n 20 data points. Complete parts a...
 Section 12.3 Multiple Linear Regression:
Number ONE:
Statistical software was used to fit the model E(y)Pox1 2x2 to n 20 data points. Complete parts a through h EEB Click the icon to see the software output. Data Table The regression equation is Y-1738.93 - 384.54x1 517.39x2 Predictor Constant X1 X2 Coef 1738.93 - 384.54 -517.39 SE Coef 369.06 101.65 - 3.78 0.002 353.04 - 1.47 0.162 4.71 0.000 s-172.003 R-sq-55.0% R-sq(adj):49.0% Analysis of Variance MS Source Regression Residual Error 17...
Section 12.3 Multiple Linear Regression:
Number ONE:
Statistical software was used to fit the model E(y)Pox1 2x2 to n 20 data points. Complete parts a through h EEB Click the icon to see the software output. Data Table The regression equation is Y-1738.93 - 384.54x1 517.39x2 Predictor Constant X1 X2 Coef 1738.93 - 384.54 -517.39 SE Coef 369.06 101.65 - 3.78 0.002 353.04 - 1.47 0.162 4.71 0.000 s-172.003 R-sq-55.0% R-sq(adj):49.0% Analysis of Variance MS Source Regression Residual Error 17...
A sample containing years to maturity and yield () for corporate bonds are contained in the...
 A sample containing years to maturity and yield () for corporate
bonds are contained in the table below.
Company Ticker
Years
Yield
GE
1.00
0.767
MS
1.10
1.716
WFC
1.35
0.897
TOTAL
1.75
1.378
TOTAL
3.25
1.748
GS
3.75
3.558
MS
4.00
4.413
JPM
4.25
2.310
C
4.75
3.332
RABOBK
4.75
2.805
TOTAL
5.00
2.069
MS
5.00
4.739
AXP
5.00
2.181
MTNA
5.00
4.366
BAC
5.00
3.699
VOD
5.00
1.855
SHBASS
5.00
2.861
AIG
5.00
3.452
HCN
7.00
4.184
MS...
A sample containing years to maturity and yield () for corporate
bonds are contained in the table below.
Company Ticker
Years
Yield
GE
1.00
0.767
MS
1.10
1.716
WFC
1.35
0.897
TOTAL
1.75
1.378
TOTAL
3.25
1.748
GS
3.75
3.558
MS
4.00
4.413
JPM
4.25
2.310
C
4.75
3.332
RABOBK
4.75
2.805
TOTAL
5.00
2.069
MS
5.00
4.739
AXP
5.00
2.181
MTNA
5.00
4.366
BAC
5.00
3.699
VOD
5.00
1.855
SHBASS
5.00
2.861
AIG
5.00
3.452
HCN
7.00
4.184
MS...
Consider the following sample data: X y 22 101 24 139 27 250 21 88 23...
 Consider the following sample data: X y 22 101 24 139 27 250 21 88 23 87 14 14 14 16 15 20 Click here for the Excel Data File b. Calculate by and bo. What is the sample regression equation? (Negative values should be indicated by a minus sign. Round your intermediate calculations to 4 decimal places and final answers to 2 decimal places.) y-hat = c. Find the predicted value for y if x equals 20, 100 and...
The first photo is the data I had collected in Minitab.I am confused on what the...
 The first photo is the data I
had collected in Minitab.I am confused on what the b1= to then get
the degree of freedom. I need this information to answer question
16 to plug in the right information in minitab to get t*multiplier.
Overall need help with getting the answer to #16 so then I can
continue the rest of the problems. Thanks! (also for 17 what is
S.E.)
Regression: icu versus age Simple Analysis of Variance Source DF Adj...
The first photo is the data I
had collected in Minitab.I am confused on what the b1= to then get
the degree of freedom. I need this information to answer question
16 to plug in the right information in minitab to get t*multiplier.
Overall need help with getting the answer to #16 so then I can
continue the rest of the problems. Thanks! (also for 17 what is
S.E.)
Regression: icu versus age Simple Analysis of Variance Source DF Adj...
 Given are five observations for two variables, x and y. 4 8 12 16 18 yi 58 51 48 14 15 The estimated regression equation for these data is y= 76.77 - 3.41x a. Compute SSE, SST, and SSR (to 2 SSE decimals) (to 2 SST decimals) (to 2 SSR decimals) b. Compute the coefficient of determination r. Comment on the goodness of fit (to 3 decimals) % of the variability in y has been explained by the estimated regression...
 Consider the following data for two variables, x and y. (a) Develop an estimated regression equation for the data of the form ý = bo + 5,x. (Round bo to two decimal places and b, to three decimal places.) Comment on the adequacy of this equation for predicting y. (Use a = 0.05.) The high p-value and low coefficient of determination indicate that the equation is inadequate. The high p-value and high coefficient of determination indicate that the equation is...
 Risk
Age
Blood Pressure
Smoker
10
59
220
1
33
67
129
0
14
68
170
0
59
63
198
0
30
65
173
0
52
74
172
1
9
77
159
0
28
73
173
0
32
68
117
1
20
80
209
1
40
62
176
1
41
82
110
0
25
67
151
1
56
55
191
0
36
61
208
1
32
61
112
1
26
78
125
0
28
75
129
0
18
90
184...
Risk
Age
Blood Pressure
Smoker
10
59
220
1
33
67
129
0
14
68
170
0
59
63
198
0
30
65
173
0
52
74
172
1
9
77
159
0
28
73
173
0
32
68
117
1
20
80
209
1
40
62
176
1
41
82
110
0
25
67
151
1
56
55
191
0
36
61
208
1
32
61
112
1
26
78
125
0
28
75
129
0
18
90
184...
 Section 12.3 Multiple Linear Regression:
Number ONE:
Statistical software was used to fit the model E(y)Pox1 2x2 to n 20 data points. Complete parts a through h EEB Click the icon to see the software output. Data Table The regression equation is Y-1738.93 - 384.54x1 517.39x2 Predictor Constant X1 X2 Coef 1738.93 - 384.54 -517.39 SE Coef 369.06 101.65 - 3.78 0.002 353.04 - 1.47 0.162 4.71 0.000 s-172.003 R-sq-55.0% R-sq(adj):49.0% Analysis of Variance MS Source Regression Residual Error 17...
Section 12.3 Multiple Linear Regression:
Number ONE:
Statistical software was used to fit the model E(y)Pox1 2x2 to n 20 data points. Complete parts a through h EEB Click the icon to see the software output. Data Table The regression equation is Y-1738.93 - 384.54x1 517.39x2 Predictor Constant X1 X2 Coef 1738.93 - 384.54 -517.39 SE Coef 369.06 101.65 - 3.78 0.002 353.04 - 1.47 0.162 4.71 0.000 s-172.003 R-sq-55.0% R-sq(adj):49.0% Analysis of Variance MS Source Regression Residual Error 17...
 A sample containing years to maturity and yield () for corporate
bonds are contained in the table below.
Company Ticker
Years
Yield
GE
1.00
0.767
MS
1.10
1.716
WFC
1.35
0.897
TOTAL
1.75
1.378
TOTAL
3.25
1.748
GS
3.75
3.558
MS
4.00
4.413
JPM
4.25
2.310
C
4.75
3.332
RABOBK
4.75
2.805
TOTAL
5.00
2.069
MS
5.00
4.739
AXP
5.00
2.181
MTNA
5.00
4.366
BAC
5.00
3.699
VOD
5.00
1.855
SHBASS
5.00
2.861
AIG
5.00
3.452
HCN
7.00
4.184
MS...
A sample containing years to maturity and yield () for corporate
bonds are contained in the table below.
Company Ticker
Years
Yield
GE
1.00
0.767
MS
1.10
1.716
WFC
1.35
0.897
TOTAL
1.75
1.378
TOTAL
3.25
1.748
GS
3.75
3.558
MS
4.00
4.413
JPM
4.25
2.310
C
4.75
3.332
RABOBK
4.75
2.805
TOTAL
5.00
2.069
MS
5.00
4.739
AXP
5.00
2.181
MTNA
5.00
4.366
BAC
5.00
3.699
VOD
5.00
1.855
SHBASS
5.00
2.861
AIG
5.00
3.452
HCN
7.00
4.184
MS...
 Consider the following sample data: X y 22 101 24 139 27 250 21 88 23 87 14 14 14 16 15 20 Click here for the Excel Data File b. Calculate by and bo. What is the sample regression equation? (Negative values should be indicated by a minus sign. Round your intermediate calculations to 4 decimal places and final answers to 2 decimal places.) y-hat = c. Find the predicted value for y if x equals 20, 100 and...
 The first photo is the data I
had collected in Minitab.I am confused on what the b1= to then get
the degree of freedom. I need this information to answer question
16 to plug in the right information in minitab to get t*multiplier.
Overall need help with getting the answer to #16 so then I can
continue the rest of the problems. Thanks! (also for 17 what is
S.E.)
Regression: icu versus age Simple Analysis of Variance Source DF Adj...
The first photo is the data I
had collected in Minitab.I am confused on what the b1= to then get
the degree of freedom. I need this information to answer question
16 to plug in the right information in minitab to get t*multiplier.
Overall need help with getting the answer to #16 so then I can
continue the rest of the problems. Thanks! (also for 17 what is
S.E.)
Regression: icu versus age Simple Analysis of Variance Source DF Adj...
Most questions answered within 3 hours.
-
Do not neglect the old for the new. The existing business must
not lose priority simply...
asked 1 hour ago -
Kylie is a single mom with two dependent children,
Tanner, age 7 and Olivia, age 11....
asked 2 hours ago -
Phosphorous + bromine = phosphorous tribromide. If 35.0 g of
bromine are reacted and 27.9 grams...
asked 4 hours ago -
Derive the long wavelength limit of the Planck energy density
distribution
asked 4 hours ago -
Calculate the pH of each of the following solutions.
0.50 M HBr
3.1×10⁻⁴ M KOH
4.2×10⁻⁵...
asked 7 hours ago -
For the year ended December 31, Depot Max’s cost of merchandise
sold was $85,600. Inventory at the...
asked 7 hours ago -
Week 10 - Professional Memo Assignment
Professional Memo Assignment
Your mission for this week, should you...
asked 7 hours ago -
Write a Python program that stores the data for each
player on the team, and it...
asked 7 hours ago -
In
the last 3 months, mike never knows when he is going to get his
allowance...
asked 8 hours ago -
Is Ca(OH)2 a Bronsted base, Lewis base, or both? Why?
asked 8 hours ago -
1A- Why don’t voters complain about U.S. tariffs on imported
sugar?
Because sugar is only a...
asked 8 hours ago -
Cash Payback Period
Primera Banco is evaluating two capital investment proposals for
a drive-up ATM kiosk,...
asked 8 hours ago