Please create a horizontal and vertical analysis Jane Doe CORPORATION CONSOLIDATED BAL...
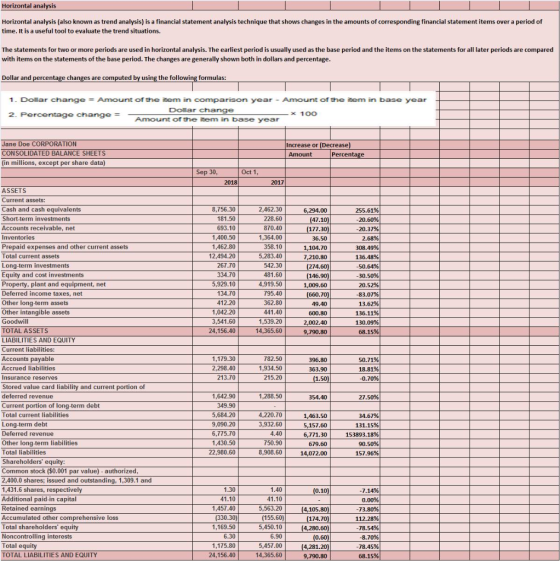
Please create a horizontal and vertical analysis
| Jane Doe CORPORATION | ||
| CONSOLIDATED BALANCE SHEETS | ||
| (in millions, except per share data) | ||
| Sep 30, | Oct 1, | |
| 2018 | 2017 | |
| ASSETS | ||
| Current assets: | ||
| Cash and cash equivalents | $ 8,756.30 | $ 2,462.30 |
| Short-term investments | 181.50 | 228.60 |
| Accounts receivable, net | 693.10 | 870.40 |
| Inventories | 1,400.50 | 1,364.00 |
| Prepaid expenses and other current assets | 1,462.80 | 358.10 |
| Total current assets | 12,494.20 | 5,283.40 |
| Long-term investments | 267.70 | 542.30 |
| Equity and cost investments | 334.70 | 481.60 |
| Property, plant and equipment, net | 5,929.10 | 4,919.50 |
| Deferred income taxes, net | 134.70 | 795.40 |
| Other long-term assets | 412.20 | 362.80 |
| Other intangible assets | 1,042.20 | 441.40 |
| Goodwill | 3,541.60 | 1,539.20 |
| TOTAL ASSETS | $ 24,156.40 | $ 14,365.60 |
| LIABILITIES AND EQUITY | ||
| Current liabilities: | ||
| Accounts payable | $ 1,179.30 | $ 782.50 |
| Accrued liabilities | 2,298.40 | 1,934.50 |
| Insurance reserves | 213.70 | 215.20 |
| Stored value card liability and current portion of | ||
| deferred revenue | 1,642.90 | 1,288.50 |
| Current portion of long-term debt | 349.90 | - |
| Total current liabilities | 5,684.20 | 4,220.70 |
| Long-term debt | 9,090.20 | 3,932.60 |
| Deferred revenue | 6,775.70 | 4.40 |
| Other long-term liabilities | 1,430.50 | 750.90 |
| Total liabilities | 22,980.60 | 8,908.60 |
| Shareholders' equity: | ||
| Common stock ($0.001 par value) - authorized, | ||
| 2,400.0 shares; issued and outstanding, 1,309.1 and | ||
| 1,431.6 shares, respectively | 1.30 | 1.40 |
| Additional paid-in capital | 41.10 | 41.10 |
| Retained earnings | 1,457.40 | 5,563.20 |
| Accumulated other comprehensive loss | (330.30) | (155.60) |
| Total shareholders' equity | 1,169.50 | 5,450.10 |
| Noncontrolling interests | 6.30 | 6.90 |
| Total equity | 1,175.80 | 5,457.00 |
| TOTAL LIABILITIES AND EQUITY | $ 24,156.40 | $ 14,365.60 |
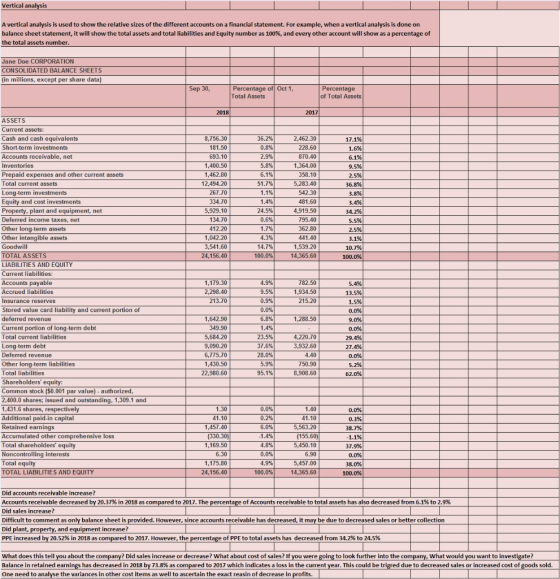
-Did accounts receivable increase? -Did sales increase? Did plant, property, and equipment increase?
-What does this tell you about the company? Did sales increase or decrease? What about cost of sales? If you were going to look further into the company, what would you want to investigate?
Homework Answers
Answer
Add Answer to:
Please create a horizontal and vertical analysis Jane Doe CORPORATION CONSOLIDATED BAL...
Please create a horizontal and vertical analysis Jane Doe CORPORATION CONSOLIDATED BALANCE SHEETS (in millions, except...
Please create a horizontal and vertical analysis Jane Doe CORPORATION CONSOLIDATED BALANCE SHEETS (in millions, except per share data) Sep 30, Oct 1, 2018 2017 ASSETS Current assets: Cash and cash equivalents $ 8,756.30 $ 2,462.30 Short-term investments 181.50 228.60 Accounts receivable, net 693.10 870.40 Inventories 1,400.50 1,364.00 Prepaid expenses and other current assets 1,462.80 358.10 Total current assets 12,494.20 5,283.40 Long-term investments 267.70 542.30 Equity and cost investments 334.70 481.60 Property, plant and equipment, net 5,929.10 4,919.50 Deferred income...
Overview and analysis of financial statement BROWN FORMAN CORPORATION CONSOLIDATED BALANCE SHEETS (Dollars in millions) 2017...
Overview and analysis of financial statement BROWN FORMAN CORPORATION CONSOLIDATED BALANCE SHEETS (Dollars in millions) 2017 2018 Assets Cash & Cash equivalents 182 239 Accounts receivable, net 557 639 Inventories 1,270 1,379 Other Current Assets 342 298 Total Current Assets 2,351 2,555 Property, plant and eqeuipment 713 780 Goodwill 753 763 Other intangible assets 641 670 Deferred tax assets 16 16 Other Assets 151 192 Total Assets 4,625 4,976 Liabilities Accounts payable and accrued expenses 501 581 Income taxes 9...
Calculate the following financial ratios for fiscal year 2018 only using the "Consolidated Statements of Earn"...
 Calculate the following financial ratios for fiscal year 2018
only using the "Consolidated Statements of Earn" and "Consolidated
Balance Sheets" worksheets in Starbucks 2017 and 2018 Annual
Financial Statements : Current Ratio, Cash Ratio, Inventory
Turnover, Days Sales in Inventory, Long Term Debt Ratio, Times
Interest Earned, Gross Profit Margin, Net Profit Margin, Return on
Equity, Return on Assets.
12 Months Ended Oct. 01, 2017 Sep. 30, 2018 Oct. 02, 2016 $ 22,386.8 9,034,3 6,493.3 500.3 1,011.4 1,450.7 153.5 18,643.5...
Calculate the following financial ratios for fiscal year 2018
only using the "Consolidated Statements of Earn" and "Consolidated
Balance Sheets" worksheets in Starbucks 2017 and 2018 Annual
Financial Statements : Current Ratio, Cash Ratio, Inventory
Turnover, Days Sales in Inventory, Long Term Debt Ratio, Times
Interest Earned, Gross Profit Margin, Net Profit Margin, Return on
Equity, Return on Assets.
12 Months Ended Oct. 01, 2017 Sep. 30, 2018 Oct. 02, 2016 $ 22,386.8 9,034,3 6,493.3 500.3 1,011.4 1,450.7 153.5 18,643.5...
Calculate the following financial ratios for fiscal year 2018 only using the "Consolidated Statements of Earn"...
 Calculate the following financial ratios for fiscal year 2018
only using the "Consolidated Statements of Earn" and "Consolidated
Balance Sheets" worksheets in Starbucks 2017 and 2018 Annual
Financial Statements: Current Ratio, Cash Ratio, Inventory
Turnover, Days Sales in Inventory, Long Term Debt Ratio, Times
Interest Earned, Gross Profit Margin, Net Profit Margin, Return on
Equity, Return on Assets.
12 Months Ended Oct. 01, 2017 Sep. 30, 2018 Oct. 02, 2016 $ 22,386.8 9,034,3 6,493.3 500.3 1,011.4 1,450.7 153.5 18,643.5 $...
Calculate the following financial ratios for fiscal year 2018
only using the "Consolidated Statements of Earn" and "Consolidated
Balance Sheets" worksheets in Starbucks 2017 and 2018 Annual
Financial Statements: Current Ratio, Cash Ratio, Inventory
Turnover, Days Sales in Inventory, Long Term Debt Ratio, Times
Interest Earned, Gross Profit Margin, Net Profit Margin, Return on
Equity, Return on Assets.
12 Months Ended Oct. 01, 2017 Sep. 30, 2018 Oct. 02, 2016 $ 22,386.8 9,034,3 6,493.3 500.3 1,011.4 1,450.7 153.5 18,643.5 $...
Calculate the following financial ratios for fiscal year 2018 only using the "Consolidated Statements of Earn"...
 Calculate the following financial ratios for fiscal year 2018
only using the "Consolidated Statements of Earn" and "Consolidated
Balance Sheets" worksheets in Starbucks 2017 and 2018 Annual
Financial Statements : Current Ratio, Cash Ratio, Inventory
Turnover, Days Sales in Inventory, Long Term Debt Ratio, Times
Interest Earned, Gross Profit Margin, Net Profit Margin, Return on
Equity, Return on Assets.
12 Months Ended Oct. 01, 2017 Sep. 30, 2018 Oct. 02, 2016 $ 22,386.8 9,034,3 6,493.3 500.3 1,011.4 1,450.7 153.5 18,643.5...
Calculate the following financial ratios for fiscal year 2018
only using the "Consolidated Statements of Earn" and "Consolidated
Balance Sheets" worksheets in Starbucks 2017 and 2018 Annual
Financial Statements : Current Ratio, Cash Ratio, Inventory
Turnover, Days Sales in Inventory, Long Term Debt Ratio, Times
Interest Earned, Gross Profit Margin, Net Profit Margin, Return on
Equity, Return on Assets.
12 Months Ended Oct. 01, 2017 Sep. 30, 2018 Oct. 02, 2016 $ 22,386.8 9,034,3 6,493.3 500.3 1,011.4 1,450.7 153.5 18,643.5...
As Reported Annual Balance Sheet Report Date 10/31/2011 Currency USD Audit Status Not Qualified Consolidated Yes...
As Reported Annual Balance Sheet Report Date 10/31/2011 Currency USD Audit Status Not Qualified Consolidated Yes Scale Thousands Cash & cash equivalents 80,886 Customer receivables, gross 144,364 Less: allowance for doubtful accounts 1,964 Customers receivables, net 142,400 Other receivables, net 5,740 Total receivables, net 148,140 Inventories, net 223,030 Prepaid expenses & other current assets 18,303 Deferred income taxes 62,523 Total current assets 532,882 Land & land improvements 26,776 Buildings & leasehold improvements 129,252 Machinery & equipment 434,796 Computer hardware &...
Vertical analysis of air canada financial statatment 2018-19 CONSOLIDATED FINANCIAL STATEMENTS AND NOTES CONSOLIDATED STATEMENTS OF...
 Vertical analysis of air canada financial statatment 2018-19
CONSOLIDATED FINANCIAL STATEMENTS AND NOTES CONSOLIDATED STATEMENTS OF FINANCIAL POSITION Canadian dollar in niland DECEMBER 31. DECEMBER 31. 2019 2018 RESTATED - NOTE 2 JANUARY 1. 2018 RESTATED - NOTE 2 $ $ $ Note 2P Note 21 2,090 3.799 5,889 157 926 102 110 332 7,516 936 12,834 Note 20 Note 21 630 4,077 4.707 161 796 109 111 417 6,301 401 12,183 1969 314 404 311 21,883 642 3,162 3,804...
Vertical analysis of air canada financial statatment 2018-19
CONSOLIDATED FINANCIAL STATEMENTS AND NOTES CONSOLIDATED STATEMENTS OF FINANCIAL POSITION Canadian dollar in niland DECEMBER 31. DECEMBER 31. 2019 2018 RESTATED - NOTE 2 JANUARY 1. 2018 RESTATED - NOTE 2 $ $ $ Note 2P Note 21 2,090 3.799 5,889 157 926 102 110 332 7,516 936 12,834 Note 20 Note 21 630 4,077 4.707 161 796 109 111 417 6,301 401 12,183 1969 314 404 311 21,883 642 3,162 3,804...
Many parties provide the cash (or capital) to finance the acquisition of SBUX’s assets. Often overlooked...
 Many parties provide the cash (or capital) to finance the
acquisition of SBUX’s assets. Often overlooked capital providers
are suppliers that we have not paid, municipalities and power
companies that we have not paid, and customers that give us cash in
advance of our delivering a product or service. These liabilities
are reported in the current liabilities section of the balance
sheet. Although these parties are technically capital providers,
they are usually thought of as financing the current assets section...
Many parties provide the cash (or capital) to finance the
acquisition of SBUX’s assets. Often overlooked capital providers
are suppliers that we have not paid, municipalities and power
companies that we have not paid, and customers that give us cash in
advance of our delivering a product or service. These liabilities
are reported in the current liabilities section of the balance
sheet. Although these parties are technically capital providers,
they are usually thought of as financing the current assets section...
Could anyone help me identify which items are operating assets and operating liabilities? Consolidated Statement of...
 Could anyone help me identify which items are operating assets
and operating liabilities?
Consolidated Statement of Financial Position - CAD ($) $ in Millions Current assets Cash and cash equivalents Accounts receivable Contract assets Inventories Prepayments Income taxes recoverable Derivative financial assets Total current assets Property, plant and equipment Intangible assets Investment in equity accounted investees Deferred tax assets Derivative financial assets Other assets Total assets Current liabilities Accounts payable and accrued liabilities Less: current portion Income taxes payable Document...
Could anyone help me identify which items are operating assets
and operating liabilities?
Consolidated Statement of Financial Position - CAD ($) $ in Millions Current assets Cash and cash equivalents Accounts receivable Contract assets Inventories Prepayments Income taxes recoverable Derivative financial assets Total current assets Property, plant and equipment Intangible assets Investment in equity accounted investees Deferred tax assets Derivative financial assets Other assets Total assets Current liabilities Accounts payable and accrued liabilities Less: current portion Income taxes payable Document...
 Calculate the following financial ratios for fiscal year 2018
only using the "Consolidated Statements of Earn" and "Consolidated
Balance Sheets" worksheets in Starbucks 2017 and 2018 Annual
Financial Statements : Current Ratio, Cash Ratio, Inventory
Turnover, Days Sales in Inventory, Long Term Debt Ratio, Times
Interest Earned, Gross Profit Margin, Net Profit Margin, Return on
Equity, Return on Assets.
12 Months Ended Oct. 01, 2017 Sep. 30, 2018 Oct. 02, 2016 $ 22,386.8 9,034,3 6,493.3 500.3 1,011.4 1,450.7 153.5 18,643.5...
Calculate the following financial ratios for fiscal year 2018
only using the "Consolidated Statements of Earn" and "Consolidated
Balance Sheets" worksheets in Starbucks 2017 and 2018 Annual
Financial Statements : Current Ratio, Cash Ratio, Inventory
Turnover, Days Sales in Inventory, Long Term Debt Ratio, Times
Interest Earned, Gross Profit Margin, Net Profit Margin, Return on
Equity, Return on Assets.
12 Months Ended Oct. 01, 2017 Sep. 30, 2018 Oct. 02, 2016 $ 22,386.8 9,034,3 6,493.3 500.3 1,011.4 1,450.7 153.5 18,643.5...
 Calculate the following financial ratios for fiscal year 2018
only using the "Consolidated Statements of Earn" and "Consolidated
Balance Sheets" worksheets in Starbucks 2017 and 2018 Annual
Financial Statements: Current Ratio, Cash Ratio, Inventory
Turnover, Days Sales in Inventory, Long Term Debt Ratio, Times
Interest Earned, Gross Profit Margin, Net Profit Margin, Return on
Equity, Return on Assets.
12 Months Ended Oct. 01, 2017 Sep. 30, 2018 Oct. 02, 2016 $ 22,386.8 9,034,3 6,493.3 500.3 1,011.4 1,450.7 153.5 18,643.5 $...
Calculate the following financial ratios for fiscal year 2018
only using the "Consolidated Statements of Earn" and "Consolidated
Balance Sheets" worksheets in Starbucks 2017 and 2018 Annual
Financial Statements: Current Ratio, Cash Ratio, Inventory
Turnover, Days Sales in Inventory, Long Term Debt Ratio, Times
Interest Earned, Gross Profit Margin, Net Profit Margin, Return on
Equity, Return on Assets.
12 Months Ended Oct. 01, 2017 Sep. 30, 2018 Oct. 02, 2016 $ 22,386.8 9,034,3 6,493.3 500.3 1,011.4 1,450.7 153.5 18,643.5 $...
 Calculate the following financial ratios for fiscal year 2018
only using the "Consolidated Statements of Earn" and "Consolidated
Balance Sheets" worksheets in Starbucks 2017 and 2018 Annual
Financial Statements : Current Ratio, Cash Ratio, Inventory
Turnover, Days Sales in Inventory, Long Term Debt Ratio, Times
Interest Earned, Gross Profit Margin, Net Profit Margin, Return on
Equity, Return on Assets.
12 Months Ended Oct. 01, 2017 Sep. 30, 2018 Oct. 02, 2016 $ 22,386.8 9,034,3 6,493.3 500.3 1,011.4 1,450.7 153.5 18,643.5...
Calculate the following financial ratios for fiscal year 2018
only using the "Consolidated Statements of Earn" and "Consolidated
Balance Sheets" worksheets in Starbucks 2017 and 2018 Annual
Financial Statements : Current Ratio, Cash Ratio, Inventory
Turnover, Days Sales in Inventory, Long Term Debt Ratio, Times
Interest Earned, Gross Profit Margin, Net Profit Margin, Return on
Equity, Return on Assets.
12 Months Ended Oct. 01, 2017 Sep. 30, 2018 Oct. 02, 2016 $ 22,386.8 9,034,3 6,493.3 500.3 1,011.4 1,450.7 153.5 18,643.5...
 Vertical analysis of air canada financial statatment 2018-19
CONSOLIDATED FINANCIAL STATEMENTS AND NOTES CONSOLIDATED STATEMENTS OF FINANCIAL POSITION Canadian dollar in niland DECEMBER 31. DECEMBER 31. 2019 2018 RESTATED - NOTE 2 JANUARY 1. 2018 RESTATED - NOTE 2 $ $ $ Note 2P Note 21 2,090 3.799 5,889 157 926 102 110 332 7,516 936 12,834 Note 20 Note 21 630 4,077 4.707 161 796 109 111 417 6,301 401 12,183 1969 314 404 311 21,883 642 3,162 3,804...
Vertical analysis of air canada financial statatment 2018-19
CONSOLIDATED FINANCIAL STATEMENTS AND NOTES CONSOLIDATED STATEMENTS OF FINANCIAL POSITION Canadian dollar in niland DECEMBER 31. DECEMBER 31. 2019 2018 RESTATED - NOTE 2 JANUARY 1. 2018 RESTATED - NOTE 2 $ $ $ Note 2P Note 21 2,090 3.799 5,889 157 926 102 110 332 7,516 936 12,834 Note 20 Note 21 630 4,077 4.707 161 796 109 111 417 6,301 401 12,183 1969 314 404 311 21,883 642 3,162 3,804...
 Many parties provide the cash (or capital) to finance the
acquisition of SBUX’s assets. Often overlooked capital providers
are suppliers that we have not paid, municipalities and power
companies that we have not paid, and customers that give us cash in
advance of our delivering a product or service. These liabilities
are reported in the current liabilities section of the balance
sheet. Although these parties are technically capital providers,
they are usually thought of as financing the current assets section...
Many parties provide the cash (or capital) to finance the
acquisition of SBUX’s assets. Often overlooked capital providers
are suppliers that we have not paid, municipalities and power
companies that we have not paid, and customers that give us cash in
advance of our delivering a product or service. These liabilities
are reported in the current liabilities section of the balance
sheet. Although these parties are technically capital providers,
they are usually thought of as financing the current assets section...
 Could anyone help me identify which items are operating assets
and operating liabilities?
Consolidated Statement of Financial Position - CAD ($) $ in Millions Current assets Cash and cash equivalents Accounts receivable Contract assets Inventories Prepayments Income taxes recoverable Derivative financial assets Total current assets Property, plant and equipment Intangible assets Investment in equity accounted investees Deferred tax assets Derivative financial assets Other assets Total assets Current liabilities Accounts payable and accrued liabilities Less: current portion Income taxes payable Document...
Could anyone help me identify which items are operating assets
and operating liabilities?
Consolidated Statement of Financial Position - CAD ($) $ in Millions Current assets Cash and cash equivalents Accounts receivable Contract assets Inventories Prepayments Income taxes recoverable Derivative financial assets Total current assets Property, plant and equipment Intangible assets Investment in equity accounted investees Deferred tax assets Derivative financial assets Other assets Total assets Current liabilities Accounts payable and accrued liabilities Less: current portion Income taxes payable Document...
Most questions answered within 3 hours.
-
3) What are the typical social structures in a global city?
asked 1 hour ago -
Luther Corporation
Consolidated Balance Sheet
December 31, 2019 and 2018 (in $ millions)
Assets
2019
2018...
asked 1 hour ago -
(Expected rate of return and risk) Carter Inc. is evaluating a
security. Calculate the investment’s expected...
asked 4 hours ago -
What specific indicators can point to lack of progress for
African Americans in American society?
asked 5 hours ago -
1-The Electrons in a beam are moving at 2.7×10⁸ m/s in an
electric field of 15000...
asked 5 hours ago -
A gas tank is a vertical cylinder. It has a radius of 1m, a
height of...
asked 5 hours ago -
Accent Software faces the following conditions. All of these
support Accent’s use of a market-penetration pricing...
asked 6 hours ago -
A mathematically inclined friend emails you the following
instructions: "Meet me in the cafeteria the first...
asked 6 hours ago -
A monopoly sells in two countries . The demand curves in the two
countries are p1...
asked 7 hours ago -
A .15kg rubber ball is bounced off a wall. Before hitting the
wall, the ball moves...
asked 8 hours ago -
A manufacturing company preparing to build a new plant is
considering three potential locations for it....
asked 8 hours ago -
B. If compound Y has approximately the same values of solubility
in toluene as compound X,...
asked 9 hours ago