
Homework Answers
MATLAB code is given below in bold letters. copy this code and paste it in am m file and name it P1.m
clc;
close all;
clear all;
% define w1 and w2 as follows
w1 = 0.2*pi; w2 = 0.3*pi;
% define n as follows
N = 100;
n = 0:N; % this corresponds to 100th order filter
% deine the impulse response of the filter
h = w2/pi*sin(n*w2)./(n*w2) - w1/pi*sin(n*w1)./(n*w1);
% first sample is given below
h(1) = w2/pi - w1/pi ;
% bartlett window implementation
h = h.*bartlett(N+1)';
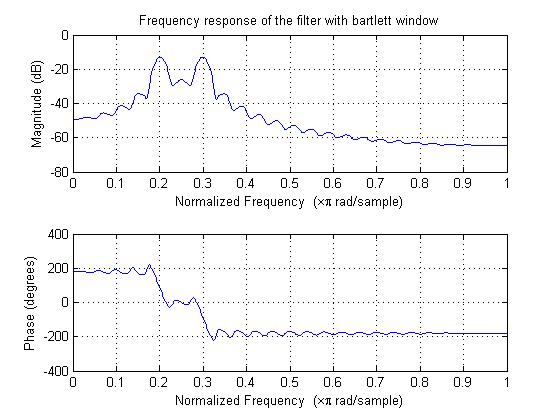
% frequency response of the filter with bartlett
window
figure;freqz(h,1);grid on;
title('Frequency response of the filter with bartlett
window');
Frequency response is plotted below
Add Answer to:
1. The impulse response of an ideal band pass filter is given by the equation: n=0 h(n)w2 sin(n w...
The impulse response of an ideal band pass filter is given by the equation: n 0 h(n)=-sin(nw.) wl...
 The impulse response of an ideal band pass filter is given by the equation: n 0 h(n)=-sin(nw.) wl sin(nw!) nヂ0 Using the above equation, write a Matlab program that implements an approximation for the band pass filter with cut-off frequencies ω1-0.2π rad/sample and c02-0.3t rad/sample. Set the order of the filter to 100 or 101. Use a Bartlett window here. Plot the frequency and phase responses of this digital filter.
The impulse response of an ideal band pass filter is...
The impulse response of an ideal band pass filter is given by the equation: n 0 h(n)=-sin(nw.) wl sin(nw!) nヂ0 Using the above equation, write a Matlab program that implements an approximation for the band pass filter with cut-off frequencies ω1-0.2π rad/sample and c02-0.3t rad/sample. Set the order of the filter to 100 or 101. Use a Bartlett window here. Plot the frequency and phase responses of this digital filter.
The impulse response of an ideal band pass filter is...
The transfer function of an ideal low-pass filter is given by: 4. a) i Prove that its impulse response is given by: a s...
 The transfer function of an ideal low-pass filter is given by: 4. a) i Prove that its impulse response is given by: a sin(na) π (na) where (Q is the cut-off frequency [-consoo] ii Is hIn] a FIR or an IIR filter? Is it causal or anti-causal filter? Explain 3 your answer. iii) If g. 0.1 π, plot the magnitude responses for the following impulse responses:
The transfer function of an ideal low-pass filter is given by: 4. a) i...
The transfer function of an ideal low-pass filter is given by: 4. a) i Prove that its impulse response is given by: a sin(na) π (na) where (Q is the cut-off frequency [-consoo] ii Is hIn] a FIR or an IIR filter? Is it causal or anti-causal filter? Explain 3 your answer. iii) If g. 0.1 π, plot the magnitude responses for the following impulse responses:
The transfer function of an ideal low-pass filter is given by: 4. a) i...
a) The transfer function of an ideal low-pass filter is and its impulse response is where...
 a) The transfer function of an ideal low-pass filter is and its impulse response is where oc is the cut-off frequency i) Is hLP[n] a finite impulse response (FIR) filter or an infinite impulse response filter (IIR)? Explain your answer ii Is hLP[n] a causal or a non-causal filter? Explain your answer iii) If ae-0. IT, plot the magnitude responses for the following impulse responses b) i) Let the five impulse response samples of a causal FIR filter be given...
EE 448 Homework #6 1. Determine the impulse response, h(n), and plot the magnitude frequency response...
 EE 448 Homework #6 1. Determine the impulse response, h(n), and plot the magnitude frequency response of each of the following FIR filters using the specified window methods. (25 pts) Low-pass filter having a cutoff frequency of /5, using the rectangular window and M-25 a. b. (25 pts) Low-pass filter having a cutoff frequency of z/5, using the Bartlett window and M=25 (25 pts) Low-pass filter having a cutoff frequency of /5, using the Hamming window and M-25 c. d....
DSP Lab Exercise 9 Given below are the Impulse Response h(n), of the four main types of FIR Digit...
 DSP Lab Exercise 9 Given below are the Impulse Response h(n), of the four main types of FIR Digital filters. Use appropriate MATLAB expressions to find: a) System Response (H(z) b) Pole-zero diagram c) Amplitude Response d) Phase Response 1. FIR Low-Pass Digital Filter ,n= 0.1 |[d(n) + δ(n-I))-1 h(n) 0, otherwise 2. FIR High-Pass Digital Filter 0, otherwise 3. FIR Band-Pass Digital Filter 0, otherwise 4. FIR Band-Stop Digital Filter , n = 0,2 0, otherwise Note: Your final...
A fourth order, Type I, linear phase, FIR filter, h[n], is to be designed using the window method. The ideal impulse response of the filter is defined as: hd[n] = sin([pi/4]*[n - N/2]) / ([n - N/2]*pi) , where N is the filter order and 'pi' denotes the ma
A fourth order, Type I, linear phase, FIR filter, h[n], is to be designed using the window method. The ideal impulse response of the filter is defined as:hd[n] = sin([pi/4]*[n - N/2]) / ([n - N/2]*pi) ,where N is the filter order and 'pi' denotes the mathematical (irrational) constant number 3.14159.... Given that a stopband attenuation of 50 dB is required,a) Find and sketch h[n]b) Determine the transfer function of the resulting digital filterc) Draw the filter block diagramd) Determine...
5 pts D Question 1 A system has the following impulse response: .2 Sample number, n From the choices below, select the frequency response of this system. H (eju)-e(1.5 ) (2 sin( 1.5ώ) +...
 5 pts D Question 1 A system has the following impulse response: .2 Sample number, n From the choices below, select the frequency response of this system. H (eju)-e(1.5 ) (2 sin( 1.5ώ) + 4 sin(0.δώ)) H (ee) = e-j(1.5e-5) (cos( 1.5 ) +2 cos(0.54)) @ H (ee)-e-n1.si) (sin( 1.54) t. 2 sin(0.δώ)) (sin(l.50) +4sin(0.0) H (ee)-e-j(1.5i) (2 cos( 1.5ώ) + 4 cos(0.5a)) H (efo)-e-n1.5u) (cos( 1.50) + 2 cos(0.50)) https://rmitinstructure.comcoursesy 5 pts DQuestion 2 A system has the following...
[MATLAB Scriptfile task] Design N-band tone vocoder with a given figure (below) in MATLAB implementing the...
 [MATLAB Scriptfile task]
Design N-band tone vocoder with a given figure (below) in MATLAB
implementing the given script file(bands_cutoff). This program
should be able to process any sound(.wav) file. Then, graph the
band-passed signals and amplitude envelopes extracted(after
rectification and low-pass filtering) and waveforms of the original
sound and vocoded sound. Additionally, using the output of the
script file, make spectrograms of the original sound and the
synthesized sound.
Bandpass filter Modulation Band-limiting Envelope detection BPF RECT LPF BPF sine...
[MATLAB Scriptfile task]
Design N-band tone vocoder with a given figure (below) in MATLAB
implementing the given script file(bands_cutoff). This program
should be able to process any sound(.wav) file. Then, graph the
band-passed signals and amplitude envelopes extracted(after
rectification and low-pass filtering) and waveforms of the original
sound and vocoded sound. Additionally, using the output of the
script file, make spectrograms of the original sound and the
synthesized sound.
Bandpass filter Modulation Band-limiting Envelope detection BPF RECT LPF BPF sine...
QUESTION 1 Characterise the following systems as being either causal on anticausal: yn)-ePyn-1)+u...
 QUESTION 1 Characterise the following systems as being either causal on anticausal: yn)-ePyn-1)+u/n), where u/h) is the unit step and B is an arbitrary constant (B>0), Take y-1)-0. Answer with either causal or 'anticausal only QUESTION 2 For the following system: yn) -yn-1Va -x(n), for a 0.9, find y(10), assuming y(n) - o, for ns -1.Hint: find a closed form for yin) and use it to find the required output sample. (xin)-1 for n>-0) QUESTION 3 A filter has the...
 The impulse response of an ideal band pass filter is given by the equation: n 0 h(n)=-sin(nw.) wl sin(nw!) nヂ0 Using the above equation, write a Matlab program that implements an approximation for the band pass filter with cut-off frequencies ω1-0.2π rad/sample and c02-0.3t rad/sample. Set the order of the filter to 100 or 101. Use a Bartlett window here. Plot the frequency and phase responses of this digital filter.
The impulse response of an ideal band pass filter is...
The impulse response of an ideal band pass filter is given by the equation: n 0 h(n)=-sin(nw.) wl sin(nw!) nヂ0 Using the above equation, write a Matlab program that implements an approximation for the band pass filter with cut-off frequencies ω1-0.2π rad/sample and c02-0.3t rad/sample. Set the order of the filter to 100 or 101. Use a Bartlett window here. Plot the frequency and phase responses of this digital filter.
The impulse response of an ideal band pass filter is...
 The transfer function of an ideal low-pass filter is given by: 4. a) i Prove that its impulse response is given by: a sin(na) π (na) where (Q is the cut-off frequency [-consoo] ii Is hIn] a FIR or an IIR filter? Is it causal or anti-causal filter? Explain 3 your answer. iii) If g. 0.1 π, plot the magnitude responses for the following impulse responses:
The transfer function of an ideal low-pass filter is given by: 4. a) i...
The transfer function of an ideal low-pass filter is given by: 4. a) i Prove that its impulse response is given by: a sin(na) π (na) where (Q is the cut-off frequency [-consoo] ii Is hIn] a FIR or an IIR filter? Is it causal or anti-causal filter? Explain 3 your answer. iii) If g. 0.1 π, plot the magnitude responses for the following impulse responses:
The transfer function of an ideal low-pass filter is given by: 4. a) i...
 a) The transfer function of an ideal low-pass filter is and its impulse response is where oc is the cut-off frequency i) Is hLP[n] a finite impulse response (FIR) filter or an infinite impulse response filter (IIR)? Explain your answer ii Is hLP[n] a causal or a non-causal filter? Explain your answer iii) If ae-0. IT, plot the magnitude responses for the following impulse responses b) i) Let the five impulse response samples of a causal FIR filter be given...
 EE 448 Homework #6 1. Determine the impulse response, h(n), and plot the magnitude frequency response of each of the following FIR filters using the specified window methods. (25 pts) Low-pass filter having a cutoff frequency of /5, using the rectangular window and M-25 a. b. (25 pts) Low-pass filter having a cutoff frequency of z/5, using the Bartlett window and M=25 (25 pts) Low-pass filter having a cutoff frequency of /5, using the Hamming window and M-25 c. d....
 DSP Lab Exercise 9 Given below are the Impulse Response h(n), of the four main types of FIR Digital filters. Use appropriate MATLAB expressions to find: a) System Response (H(z) b) Pole-zero diagram c) Amplitude Response d) Phase Response 1. FIR Low-Pass Digital Filter ,n= 0.1 |[d(n) + δ(n-I))-1 h(n) 0, otherwise 2. FIR High-Pass Digital Filter 0, otherwise 3. FIR Band-Pass Digital Filter 0, otherwise 4. FIR Band-Stop Digital Filter , n = 0,2 0, otherwise Note: Your final...
 5 pts D Question 1 A system has the following impulse response: .2 Sample number, n From the choices below, select the frequency response of this system. H (eju)-e(1.5 ) (2 sin( 1.5ώ) + 4 sin(0.δώ)) H (ee) = e-j(1.5e-5) (cos( 1.5 ) +2 cos(0.54)) @ H (ee)-e-n1.si) (sin( 1.54) t. 2 sin(0.δώ)) (sin(l.50) +4sin(0.0) H (ee)-e-j(1.5i) (2 cos( 1.5ώ) + 4 cos(0.5a)) H (efo)-e-n1.5u) (cos( 1.50) + 2 cos(0.50)) https://rmitinstructure.comcoursesy 5 pts DQuestion 2 A system has the following...
 [MATLAB Scriptfile task]
Design N-band tone vocoder with a given figure (below) in MATLAB
implementing the given script file(bands_cutoff). This program
should be able to process any sound(.wav) file. Then, graph the
band-passed signals and amplitude envelopes extracted(after
rectification and low-pass filtering) and waveforms of the original
sound and vocoded sound. Additionally, using the output of the
script file, make spectrograms of the original sound and the
synthesized sound.
Bandpass filter Modulation Band-limiting Envelope detection BPF RECT LPF BPF sine...
[MATLAB Scriptfile task]
Design N-band tone vocoder with a given figure (below) in MATLAB
implementing the given script file(bands_cutoff). This program
should be able to process any sound(.wav) file. Then, graph the
band-passed signals and amplitude envelopes extracted(after
rectification and low-pass filtering) and waveforms of the original
sound and vocoded sound. Additionally, using the output of the
script file, make spectrograms of the original sound and the
synthesized sound.
Bandpass filter Modulation Band-limiting Envelope detection BPF RECT LPF BPF sine...
 QUESTION 1 Characterise the following systems as being either causal on anticausal: yn)-ePyn-1)+u/n), where u/h) is the unit step and B is an arbitrary constant (B>0), Take y-1)-0. Answer with either causal or 'anticausal only QUESTION 2 For the following system: yn) -yn-1Va -x(n), for a 0.9, find y(10), assuming y(n) - o, for ns -1.Hint: find a closed form for yin) and use it to find the required output sample. (xin)-1 for n>-0) QUESTION 3 A filter has the...
Most questions answered within 3 hours.
-
A solid, uniform disk of radius 0.250 m and mass 53.7 kg rolls
down a ramp...
asked 1 hour ago -
Given the following table of high speed internet access vs.
annual home income:
Home Income
%...
asked 2 hours ago -
A baseball batter hits a 0.145kg baseball straight up into the
air. The baseball leaves the...
asked 2 hours ago -
An FM modulator is tested using
single-tone baseband signal with frequency of 50kHz and a sprectrum...
asked 2 hours ago -
Write the ionic equations for the first stage of salts
hydrolysis.
Anion, Cation?
Na2S
NiSO4
K2SO4...
asked 4 hours ago -
suppose there is a normally distributed population with a mean of
250 and a standard deviation...
asked 5 hours ago -
Question Three
Suppose you as project manager are using the Waterfall
development methodology on a large...
asked 6 hours ago -
Which statement is not true about welfare in Canada?
A.Benefits typically vary based on one's ability...
asked 6 hours ago -
Please help me with FLOWCHART and UML diagram for class,
thank you!
#include <iostream>
#include <fstream>...
asked 7 hours ago -
3. Describe the “logic circuit” of the Lac operon. Which
proteins are bound or not to...
asked 7 hours ago -
Ayesha’s adjusted gross income is $60,000 in 2019. She donated a
piece of artwork with a...
asked 7 hours ago -
For Dijkstra’s shortest path algorithm:
a. Give the Big-O time for Dijkstra’s shortest path algorithm
and...
asked 7 hours ago